
Christmas, I mean Tableau Conference, came early this year! That’s right, the 2022 Tableau Conference has already come and gone, but we’re here with a recap of all the updates and announcements you crave. Don’t worry if you missed anything! Sessions will be up on the conference site by Friday, May 20, and the keynote is available on YouTube now.
Big News at Tableau Conference
Here are some key takeaways we’ll dive into in this post:
- Tableau Online is now Tableau Cloud. It’s long been coming, but this appears to be a big move into a cloud-first world for Tableau. Almost every demo was shown in the browser on Tableau Cloud.
- Tableau Cloud will support multiple sites with centralized management, and advanced management features are on their way.
- The future will include much deeper integration into other Salesforce products with features like Tableau Actions (which uses Salesforce Flows), and sales bundles such as the announced Tableau Cloud.
- Data Stories for Tableau is a new feature that auto-generates text based on the data in your dashboard to make it easier to share insights and reach more people.
- Model Builder for Tableau brings data science and advanced analytics to the masses with a new, no-code-required tool.
- Lots of new features to make your day-to-day in Tableau better.
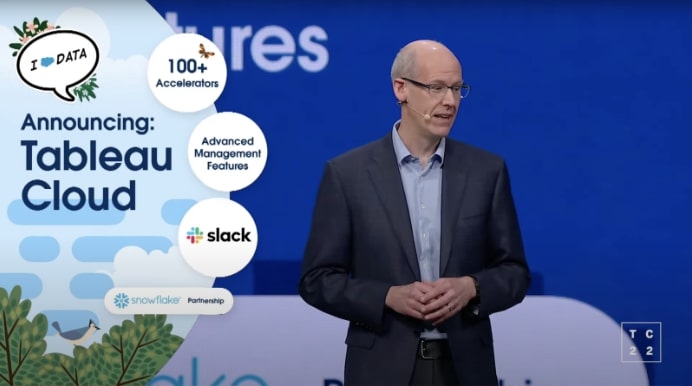
Above: A peek at the Tableau Cloud announcement
Tableau Cloud
There are some important announcements here. Tableau Cloud launched immediately and has 100+ accelerators (pre-built dashboards) and advanced management features. To kick things off, they are also giving away free Snowflake credits.
Perhaps most exciting was the announcement of support for multiple sites. Multiple sites on Tableau Online has been a big request from companies for a long time. Tableau Cloud now supports the management of multiple Tableau sites and makes it easy to individually deploy to regions worldwide while staying centrally managed.
Other key Tableau Cloud announcements include:
- A new Advanced Management offering, including things like customer-managed encryption keys.
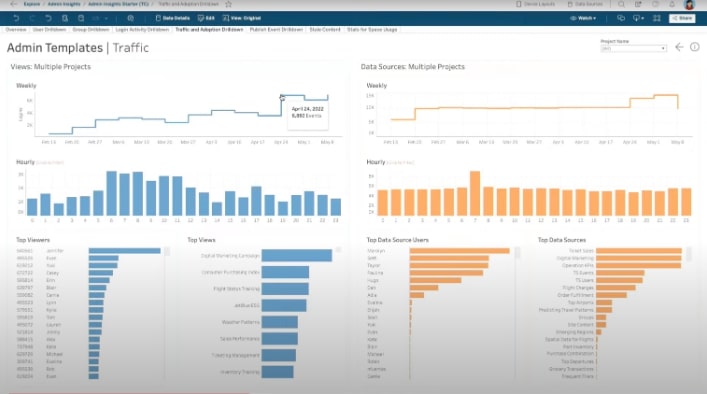
- Admin Insights – published data sources and dashboards on your Tableau content and sites to better understand use and adoption. In the past, this data was only available with Tableau Server via the system Postgres database.
- Dashboards can now be shared publicly without the need for logins or licenses. In the past, companies trying to achieve this have used Tableau Public, but this new change removes some extra steps and keeps the content directly under your control.
Above: Publicly sharing dashboards via Tableau Cloud
Data Stories for Tableau
Coming off of their acquisition of Narrative Science, Tableau is announcing this feature that they see as the future of analytics. Inside any dashboard, you can create a data story simply by dragging it onto the dashboard and selecting the worksheet you want to use for data. Then watch as Tableau writes the story:
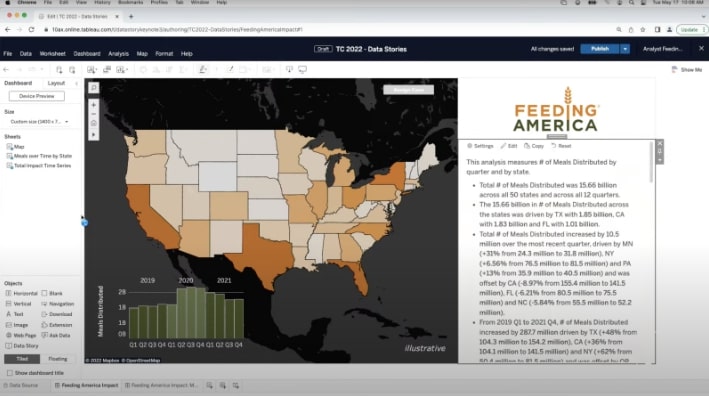
The Data Stories feature also includes a lot of customization, including settings for controlling how verbose the text will be, how numbers should be formatted and thresholds for what will be considered relevant, among other options. Additionally, this is dynamic, responding to filters in your dashboard, which allows the story to change based on user input.
Significantly, this feature should help Tableau customers make data more accessible for those using screen readers. Many questions remain on how good these stories will be on data in the wild, but it’ll be exciting to check it out!
Model Builder for Tableau
With Tableau, you’ve always been able to connect to your data (100+ data sources), clean and transform it with Tableau Prep and visualize it beautifully with Tableau Desktop. The only thing missing has been the ability to model your data. That changes with Model Builder for Tableau! Model Builder is built upon Salesforce’s Einstein but brought right into the core Tableau experience:

Above: Data science with Model Builder in Tableau
Model Builder will help customers address predictive analytics, scenario planning/simulations and machine learning. It will make it easy to apply those models to your data and monitor them over time:

Above: Data science with Model Builder in Tableau
You can create models in the same way you make any asset on Tableau Cloud. On your homepage, just click the new button and select models. You’ll pick the data you want to connect to (any published data source), select the field you want to predict (and the goal and algorithm) then watch Tableau train your model. Once it’s done, you’ll get visualizations to help you review the model performance alongside helpful guidance:
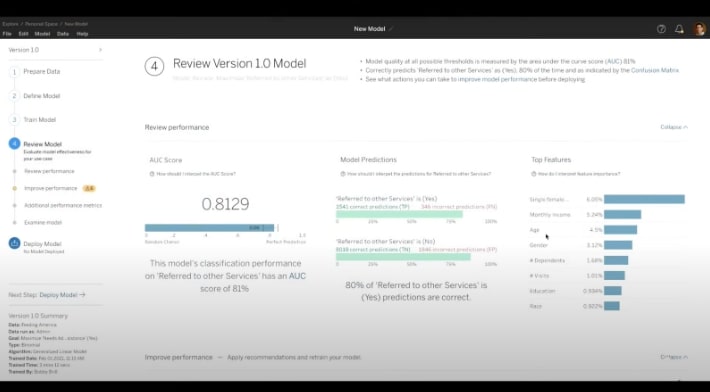
Above: Review analytics model performance with Tableau Model Builder
The Best of the Rest: Devs on Stage
Devs on Stage this year was part of the main keynote and was a rapid-fire showcase of new features. Here’s the best of what we saw:
- Shared Dimensions in data models – The new relationships model brought lots of flexibility to Tableau data sources, and shared dimensions take that even further. Now, you can build a single data model with multiple fact tables that can be deployed to your organization.
- Web Data Connector 3.0 – No more servers or URLs needed! You can now apply web connections via the Tableau Exchange, so you can connect to data from things like your Twitter account with ease. As a bonus, these connectors now run locally, relieving some previous security concerns.
- Table Extensions – R, Python and Einstein Discovery can now be applied directly in your Tableau data model. You can run code right in Tableau to clean, transform and score your data. This will make applying models to your data easier (and more efficient) and should replace some current uses of External Services.
- Tableau Prep enhancements – Adding row numbers may seem small, but the ability to add them (and track the order of your data) is highly beneficial. Tableau also announced the ability to fill nulls quickly and the addition of multi-row calculations (for things like moving sums).
- Ask Data Improvements – You can now enable your dashboard users to launch Ask Data from your dashboard to answer further questions. Once there, users will see a new Ask Data experience that makes suggestions, shows available fields and generally makes it easy for the average user to get quality results.
- Data Orientation pane – A new part of the Tableau interface, the Data Orientation pane is a slide-out panel where you can put dashboard descriptions, resources and links. This is a simple but important feature that should help end-users understand a dashboard’s what, how and why.
- Image Role Feature – Bringing images to Tableau has always been a manual job. No longer! Tableau can now take image URL links stored in your data and render those images right in your visualizations. Dynamic images now are easy to create and easy to update.
That’s a Wrap!
Tableau has undoubtedly brought the heat this year, and there’s a lot to be excited about. We’re starting to see the benefits of their more integrated and cloud-first approach with features such as Data Stories and Model Building, as well as in refined offerings such as Tableau Cloud.
If you have questions about what this can mean for your organization, reach out to us! As one of Tableau’s first partners, we’re deeply acquainted with the Tableau ecosystem and would love to help extend your understanding or equip you with practical skills to enhance your analytics. Or, if you just want more Tableau Conference content, check out my session on Building Products with Tableau.