
Please note that Portals for Tableau are now officially known as Curator by InterWorks. You can learn more at the official Curator website.
When 2019.1 released, Tableau added a new capability to its industry-leading analytics platform called Ask Data. This feature allows for users to perform ad hoc analytics without learning SQL, programming or even the easy-to-learn, drag-and-drop-enabled visual analytic tool, Tableau Desktop. Ask Data leverages natural language algorithms to determine what a user is trying to “Ask” of the “Data” – see what I did there? 😊 Here’s a blog on Tableau’s website that announced Ask Data in 2019.1 beta.
Who Should Use Ask Data?
The user we most commonly see as a best fit for Ask Data is that user in your organization who knows something about your organizational data and/or asks questions about your organizational data but doesn’t have either the time or the interest in building dashboards and worksheets in Tableau. There are many users who fit this category, but I’m going to address three types:
- The Executive – Maybe your CEO asks questions that aren’t answered directly by the dashboards on your Tableau Server. Maybe your CFO just wants to see the data for themselves. Maybe your CMO enjoys the experience of asking questions in a more common way rather than going to a dashboard.
- The Frontline Employee – Perhaps you are a retail, restaurant or B2C operation that requires your employees to make decisions on data, but because of the nature of their role, they constantly have other questions more unique to their circumstance where building a drilldown dashboard may not make the most sense. These employees probably don’t have a strong SQL background either, and even if they did, database access would be challenging at best to manage. This employee can be given a dataset (and if it’s live can be filtered to their data) and ask questions as they wish.
- The Inquisitive Non-Technologist – Maybe a user is strong with people and processes, but they really do not enjoy working on creating technology solutions. They don’t even love Excel (but Excel fans can love Ask Data, too!). They are not interested in Tableau Desktop, and the Web Authoring license you gave them has gone unused. However, they understand data is important to doing their job well—enter Ask Data. This person may be a Director of HR, a supervisor in operations, a manager in marketing, a regional lead in your organization, or anyone in between.
Tableau’s natural language tool, Ask Data, is perfect for these users, and even the more technical user who knows a dashboard may not need to be built to get the question answered.
What is Natural Language?
To understand natural language and what it takes to make this work well while keeping users “in the flow,” we need to first remember how Tableau works. At its core, Tableau uses a proprietary process called VizQL to draw pictures (maps, bar graphs, scatterplots, etc.) based upon SQL queries. Therefore, at its core, Tableau still has always relied upon query languages to get its job done. Ask Data now shifts this paradigm. Let us take a look.
I built this visual that is leveraging a Snowflake data connection. This is a fake restaurant company dataset, and this worksheet is showing current year sales by Destination for the last three months:
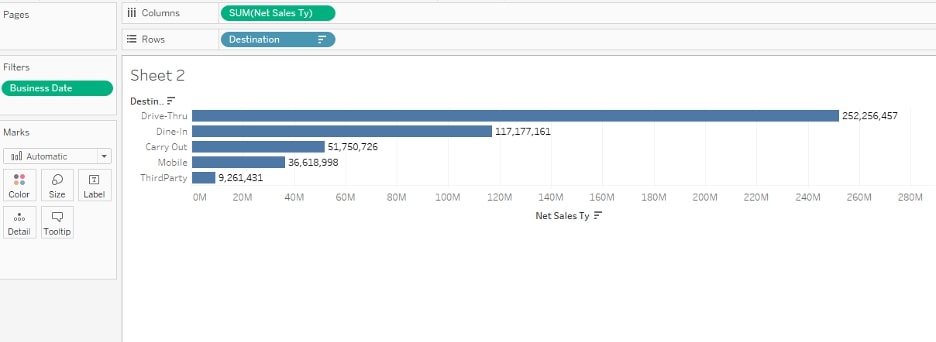
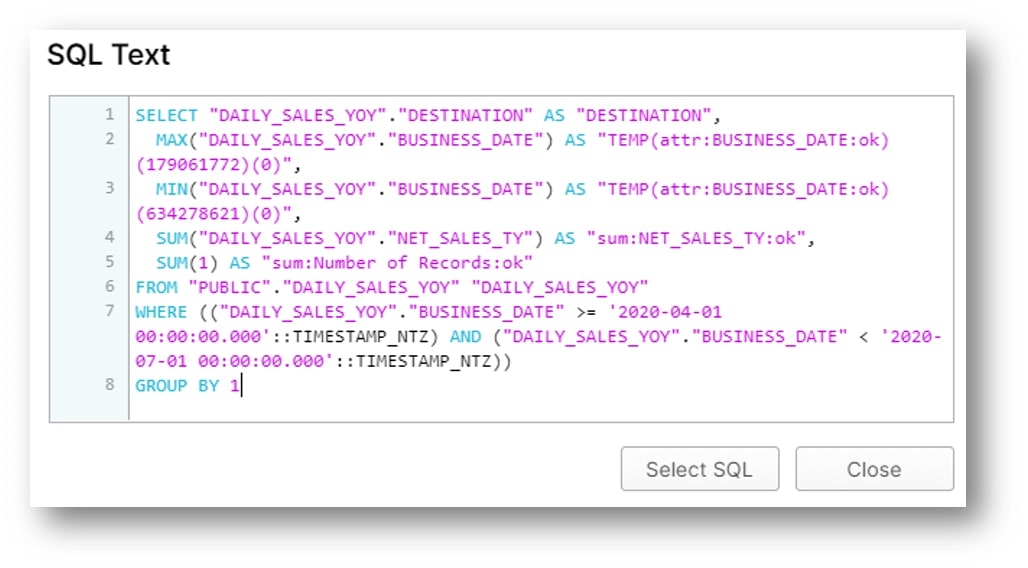
When the visual is complete, here is the SQL that Tableau executed in Snowflake:
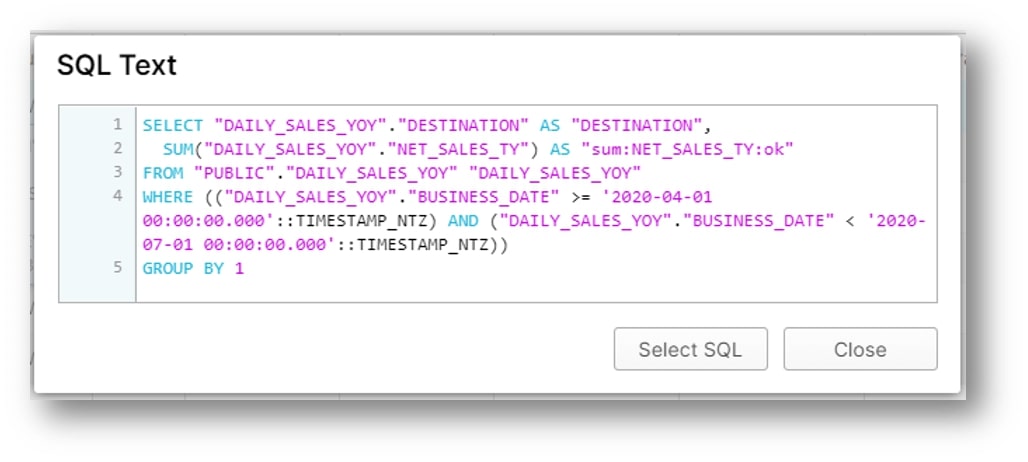
For Ask Data to work, it would have to do the same thing, but without a user dragging Net Sales to the Columns shelf, Destination to the Rows shelf and Business Date to the Filter shelf.
We would want Ask Data to be able to answer the question: “What were Sales by Destination for the last three months?”. Swapping over to our server and asking this exact question looks like this:
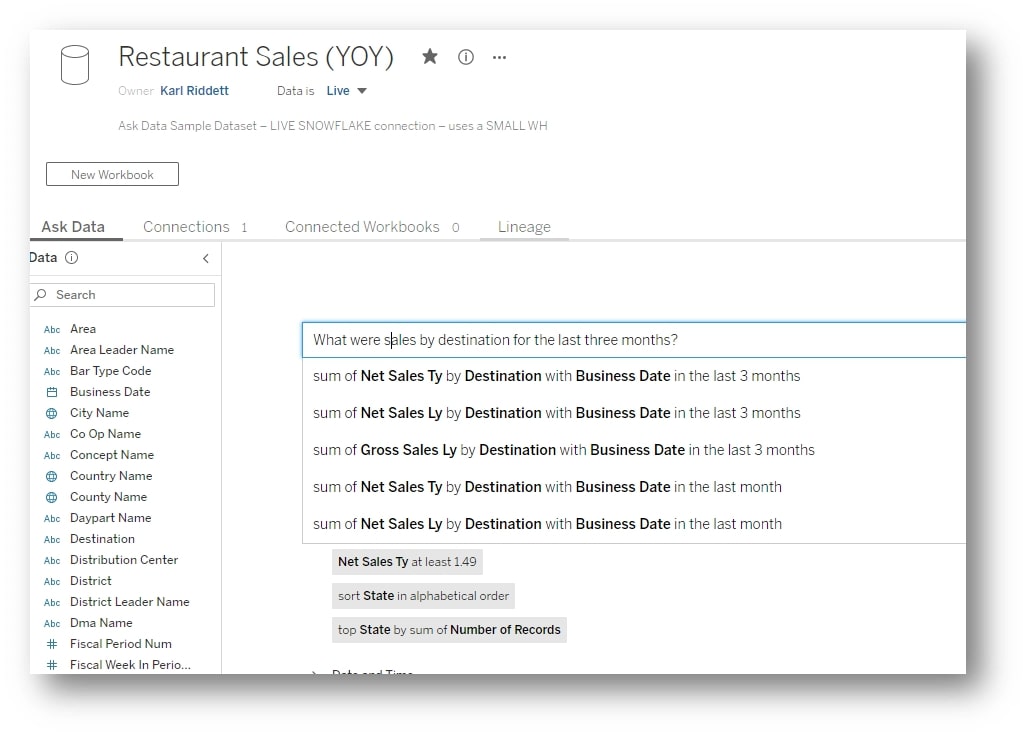
Note that Tableau is asking me which sales field to use but already found the field Destination and is filtering Business Date in the last three months. Here is the Ask Data output when I select that top option:
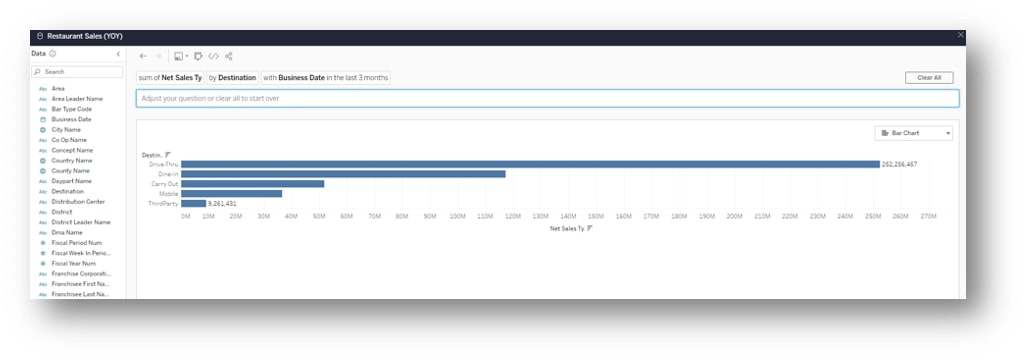
It looks identical to the viz we created in Tableau Desktop. Here is the Snowflake query executed:
More Ask Data Features
Visual Representation of Metadata and Distribution of Domain
Once the data engine analyzes a published data source on Tableau Server, users can then hover over each column to explore more deeply what the values are. This is very helpful in growing data literacy in your organization. Check it out:
If your data source changes significantly or you just want this metadata updated, you can always rerun the analysis by clicking on the i icon next to the Data title:
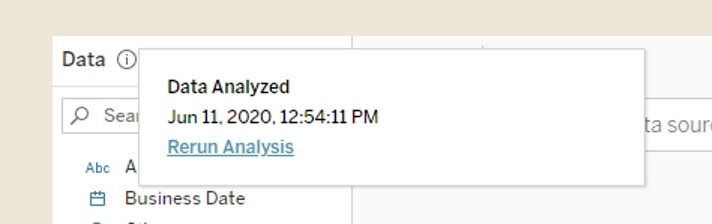
This window shows when the last analysis was run, as well as a link to rerun the analysis.
Searching Values in Addition to Column Names
Ask Data will allow users (if they are not familiar with the data) to just start typing in values. Instead of trying to remember “Was it the State or District I am looking for the value of ‘Oklahoma’ for?” or “Was it even County?”, Ask Data handles this for you. This was not always the case either. They have recently added this feature into the product:
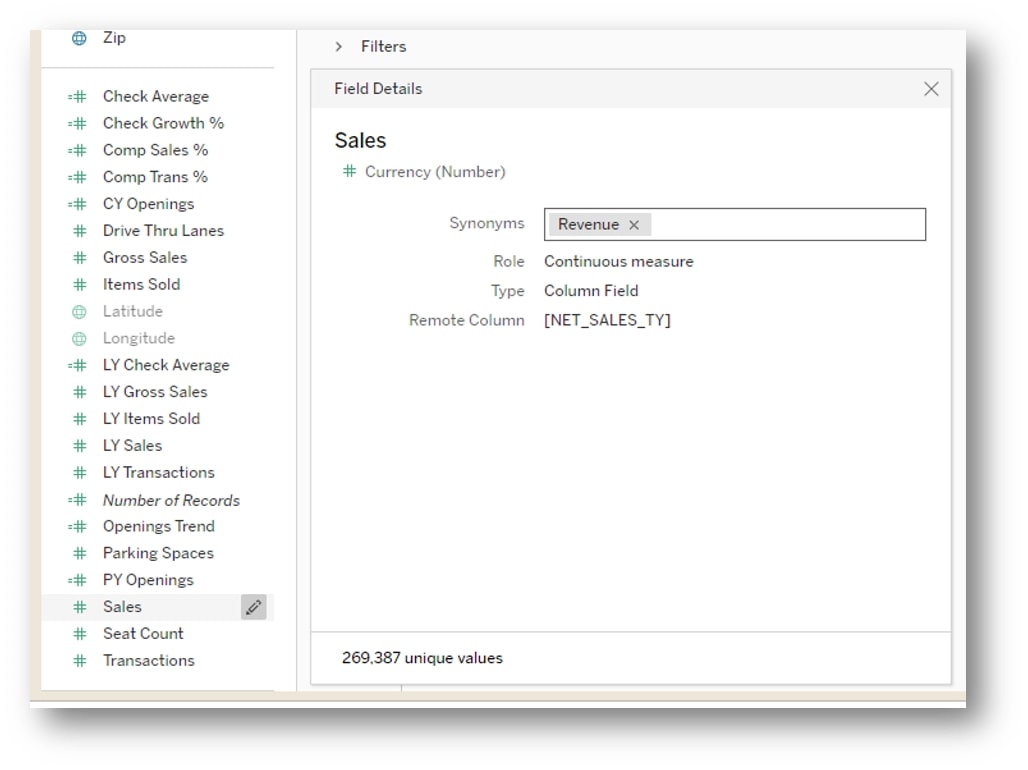
Building Synonyms of Metadata
One way to ensure users can maximize their use of Ask Data is to add synonyms to the column names. Take this example. We have a column called Sales, but some users may call it Revenue. By clicking on the Edit icon (pencil) next to the column, we can add Revenue as an alias:
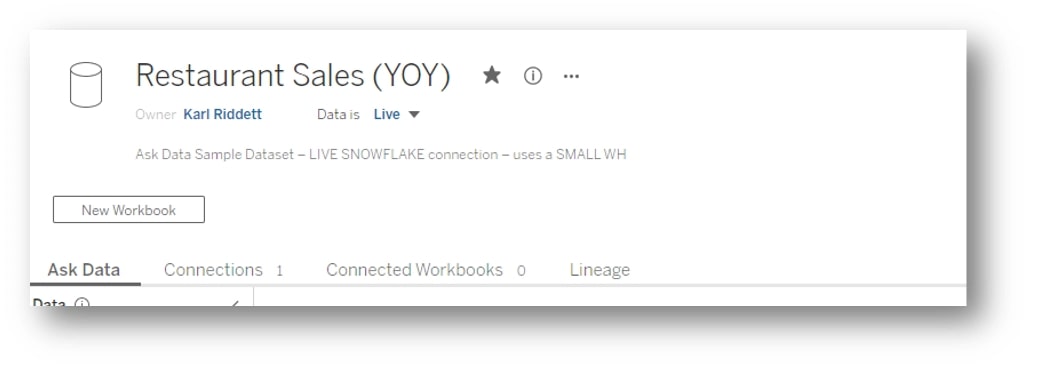
Ask Data Can Be Live or an Extract
In the example above, we published a live data source connected to Snowflake to our Tableau Server, and Ask Data let us start asking questions:
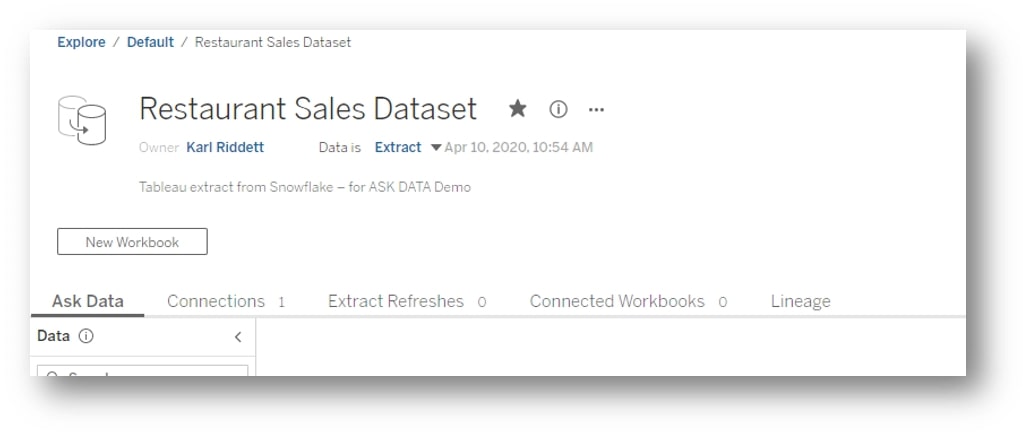
Extracts can also be used:
Note: One thing to make sure of is if you use a live connection, make sure your database can handle the concurrency and workloads that will be created by Ask Data queries. Snowflake is an excellent database for this as it leverages isolated workloads, so concurrency is not an issue, and all queries are cached for 24 hours, allowing common questions to return instant results and not affect compute charges. If you are not sure or you know that your database cannot handle the demand of Ask Data, leverage a Tableau Hyper Extract.
Preparing Your Data for Ask Data
It is critical to ensure your dataset is ready for Ask Data users. Tableau has a great whitepaper they provide, but here are some quick tips, too:
- If it’s a live connection, make sure your database is ready to handle the volume.
- Alias or rename columns to simplify things for your users.
- Remove any unneeded columns (status columns, table calc fields, flags, etc.).
- Build your calculated fields with comments, or make them legible and understandable. Add synonyms wherever possible.
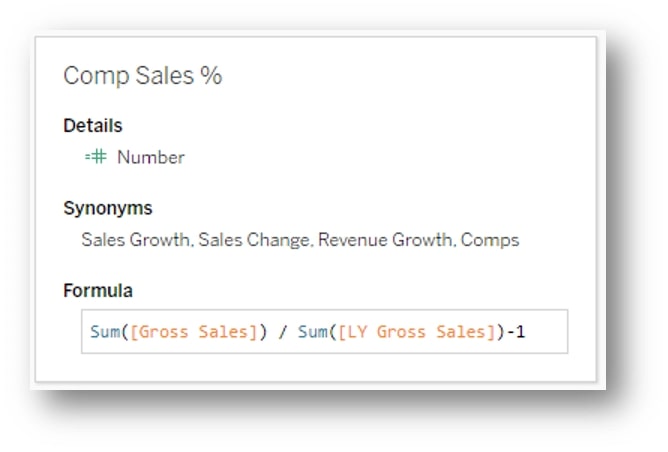
If you do it right, you’ll have optimized your user experience like this:
Shortcomings of Ask Data
A few things Ask Data cannot do yet:
- Map latitude and longitude – only symbol or filled maps based upon standard geographies (e.g. countries, states, counties) can be mapped
- Allow for control of the Marks card – sometimes, Ask Data will plot something on Color or Size, but currently users cannot tell Ask Data to do this for them. The workaround here is once your ad hoc question is answered and you want to move this to a dashboard, you can save your Ask Data session as a workbook on your server then edit it through web authoring or Tableau Desktop.
- Not all Tableau users have Ask Data available to them – at the time of writing this, only Explorers and Creators have access to use Ask Data or if you are in a CORE license model. Viewers do not have Ask Data.
- No row-level security in Ask Data unless you are using a live database connection with user security built in.
Summary
Overall, Ask Data is a great solution for those ad hoc questions where users may not want to invest in building a dashboard or worksheet. While it has some shortcomings still, Tableau has spent significant resources since 2019.1 making the product what it is today. If you currently own Tableau or are looking to do both dashboarding and ad hoc natural language, this should meet your needs without needing to purchase an add-on solution from another product.
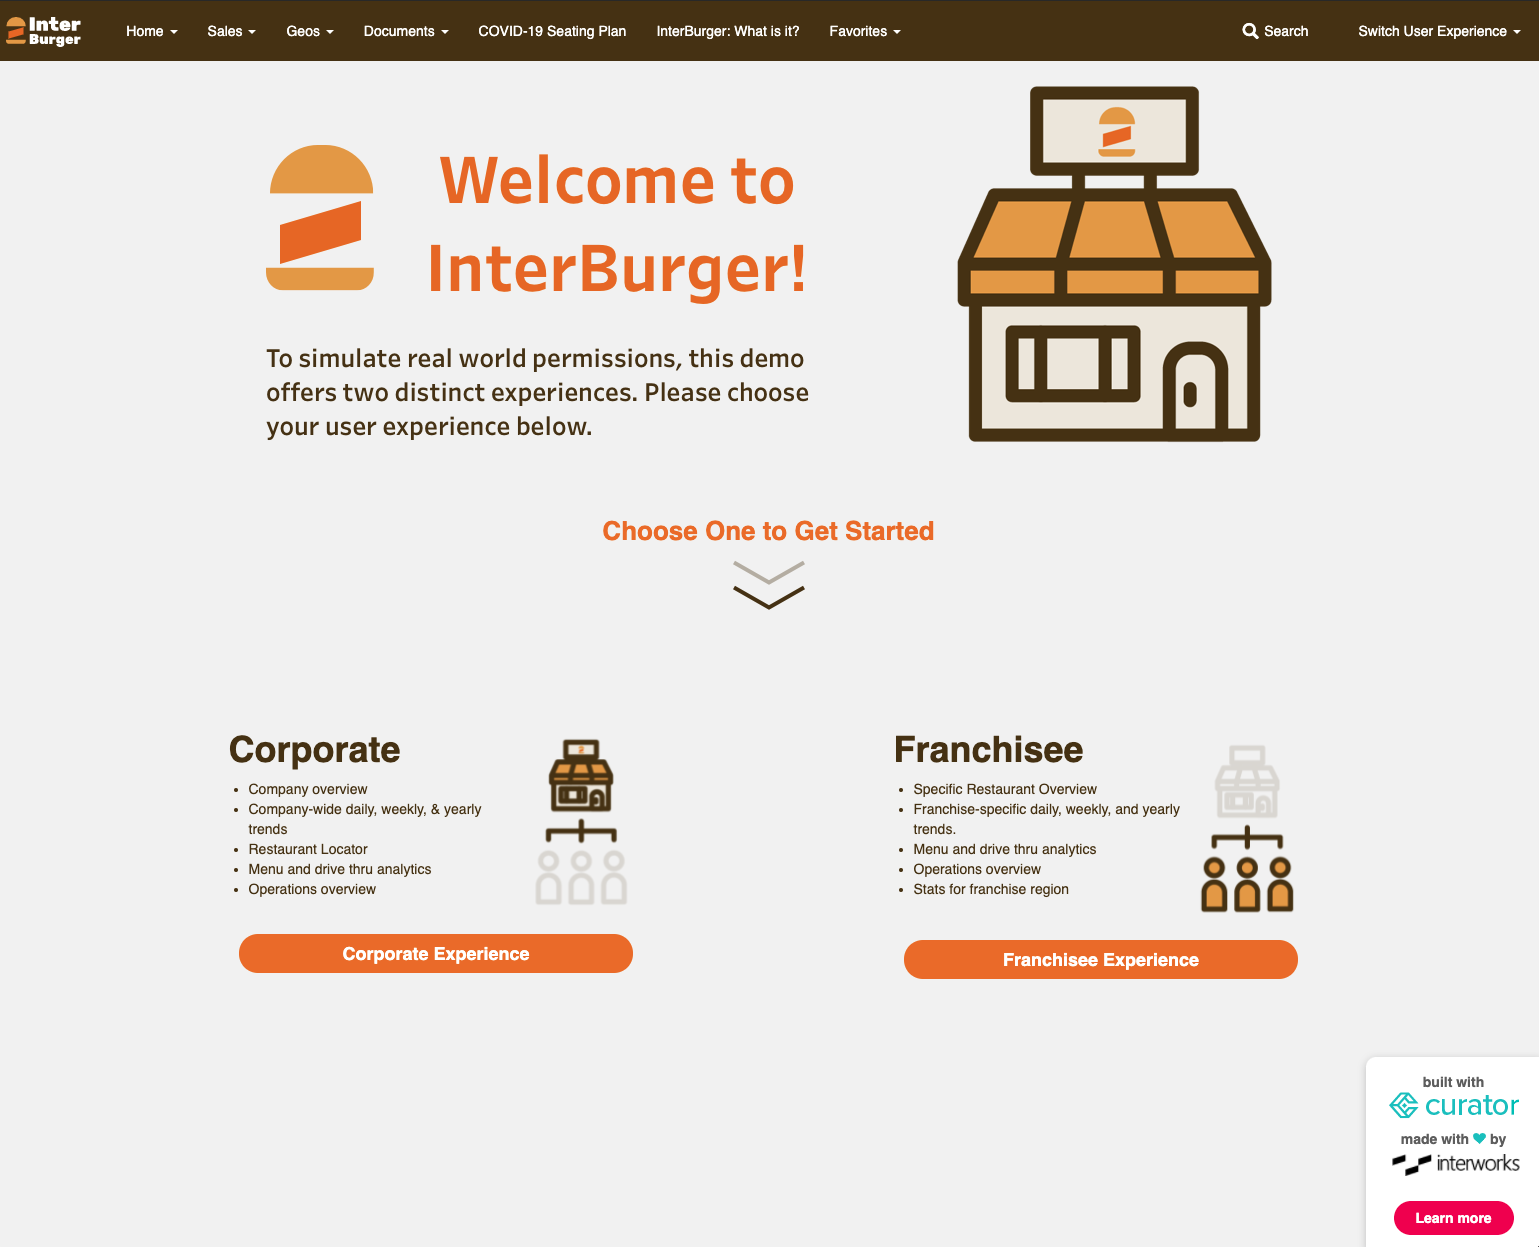
Heck, try it for yourself. We have an interactive demo for you to try in InterBurger, a fictitious restaurant proof of concept that leverages Tableau, Snowflake and embedded analytics through our InterWorks portal with custom experience and branding. Click the image below to explore:
As always, we at InterWorks would love to help you and your organization take the next step towards data literacy and ad hoc analysis. Please reach out if we can support you in any way.