Video replays for this webinar are available at the bottom of the blog.
Today, we’re going to dive into the world of Natural Language Processing (NLP), some popular industry use cases for NLP and how you can leverage NLP in a common business intelligence workflow.
Natural Language Processing at a Glance
NLP is a suite of data-processing tasks and algorithms that are designed to enable computers to understand our complicated rules of human language. It systematically breaks down language into small, bite-sized pieces that can be interpreted by machines. The ultimate goal of NLP is to dissect the idiosyncrasies and nuances of our language to summarize and utilize data that lacks context or structure.
It’s a generally held belief that there’s not much overlap in applications of NLP and BI, which uses more structured data, but there are still valuable use cases where we can utilize NLP.
As of the time of this presentation, 80% of data is reportedly text-based. This includes things like customer feedback, surveys, interactions, change logs and more. Being able to access this otherwise-unusable data with your pipeline can be invaluable when making decisions.
NLP is All Around Us
Whether it’s customer service chat bots, virtual assistants or the Google search bar, most people interact with NLP every day. A search engine, for instance, will pull key words from a search and use that to find what content users who have searched for similar things used. While this is a very simplified version of what a search engine can do, it illustrates just a small fraction of NLP’s use.
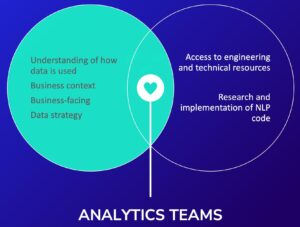
With NLP’s increased use and accessibility, there’s an increased demand for NLP as a way of making the user experience easier and more accessible, in addition to the benefits that come from being on the leading edge of NLP development. A team of analysts serves as the perfect bridge between the highly technical development stage and a general audience like interested stakeholders:

NLP in Business Intelligence
There are three major use cases for NLP in a BI realm: data labeling, classification and summarization.
- Data labeling is widening the output of your dataset by attaching NLP outputs. This is especially useful for something like an open response on a survey where NLP can detect if something was positive, negative or neutral, for example.
- Classification is taking pretext records and assigning structure or grouping to them based on the theme of the texts. If you wanted to have a section that looked specifically for your product name mentions, classification could create better groups to better structure your data.
- Summarization is a growing use case that deals with taking a dataset or data tool and writing a report about trends without an analyst needing to go through a dataset and do so manually.
Where NLP Fits in the BI Ecosystem
NLP can be used in several different layers in the BI ecosystem, like the extract (ETL) layer, preparation layer and interaction layer—each with its own benefits:

Implementing NLP in the ETL layer allows users to interact with the data at scale in the cloud. This also gives analysts access to a number of tools and services designed specifically for this layer. If the data is run through an NLP task here, the results are readily available for other analysts further down the pipeline to use for their own purposes. As a note, this layer of implementation may not be good if users are still in the exploration phase without clear direction of where they want to go in a project.
The biggest advantage of implementing NLP in the preparation layer is the increased specificity of what the NLP can do or look for in the data. With the data brought this far into the pipeline, the NLP can be used with much better control over what results an analyst may be looking for.
In the analytics interaction layer, there’s a growing use case in the push for no-code tools that allow users to augment their dashboards with a service or tool that lets them create results in natural language that can be shared over Slack or other channels. There’s now a suite of programs, like in Tableau Server, that lets analysts create those natural language results for increased ease of use.
NLP in Practice
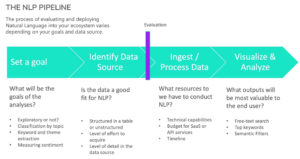
There are four stages in the NLP pipeline: set a goal, identify the data source, ingest/process data, visualize and analyze. This four-step process should help guide what an analyst should be looking for with a potential NLP implementation:

First, the analyst should clearly define what the goal of an analysis is. This includes deciding if it’s exploratory or not. Next, the analyst should determine if the data is a good fit for NLP, especially if it’s structured or unstructured. Then, the analyst should find out what resources they have available to conduct the NLP. For the final step, the analyst should decide what outputs will be most valuable to the end user.
Applying These Concepts
Utilizing NLP, I was able to create this dashboard by analyzing Toyota-themed subreddits from Reddit. By analyzing the words used by Redditors about their Toyotas, I was able to see what words had negative and positive connotations, what kind of pain points they were having and how many interactions a given subreddit had.
This is just an example of the insights that can be provided by an NLP integration:
If you’d like to see this presentation in full, the replay is listed below. If you’re wanting to sign up for any future webinars, or just see what we have in store, check out our webinar page.

