
The final blog in this mini series on Tableau table calculations focuses on more advanced capabilities users can execute. The first post discussed a foundational understanding of table calculations, and the second tackled the various types of calculations that exist and their variations. Here, we’re jumping straight into the ways you can take table calcs further in your analytics.
Compute Using Specific Dimensions
Consider this table with my [Sales] by [Category] and [Sub-Category] again, but it also has some states in the U.S. to split it up a bit further and Year across the top. I want to add a table calculation to see the Total [Sales] by [Category] and Year regardless of both [Sub-Category] and [State]:
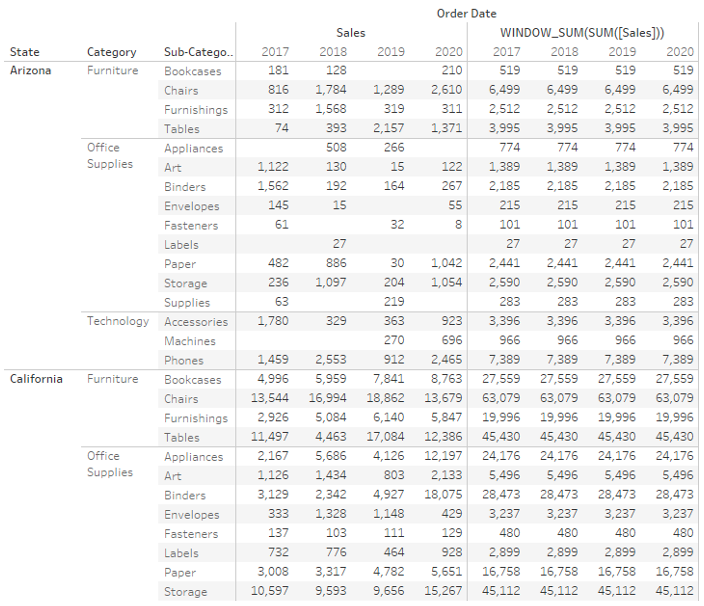
If I add a simple WINDOW_SUM(SUM([Sales])) it has no idea what my window is that I want to calculate the total over. By simply dropping this calculation in my view, it is Computed Using Table (across) and it is simply summing up my sales for every [State], [Category] and [Sub-Category] regardless of year.
In this case, we need to tell Tableau how to calculate the WINDOW_SUM exactly. I can change the Compute Using to Table (down), which would simply give the totals by year. Table (across then down) and Table (down then across) would give the overall total. Pane would limit the calculation to the second dimension from the right on the Columns shelf if selected across or the Rows shelf if down. Cell would only perform the calculation on a single cell level:
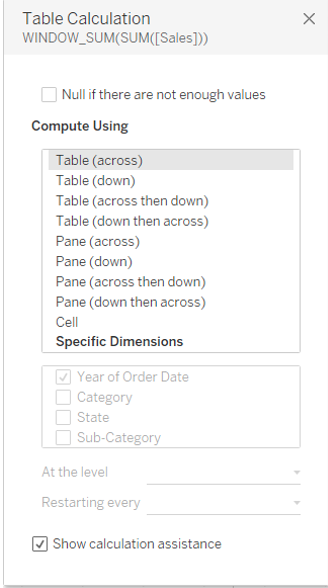
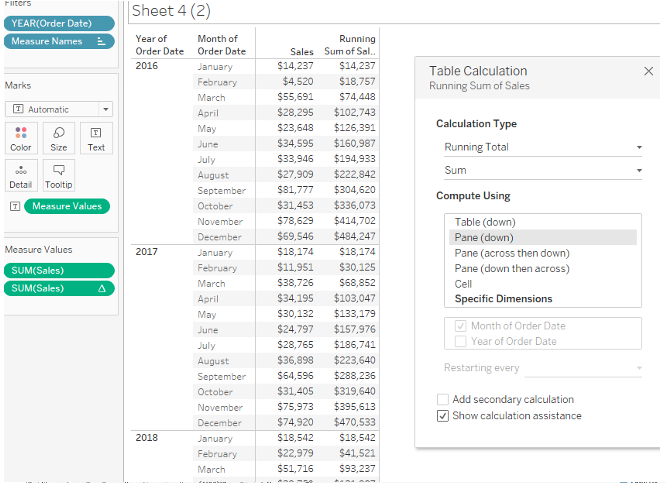
Now, in this situation I want to calculate across my pane, going down, and continue across the next pane, going down, with the same [Category] label. Across the table in this case means across the years, since my years go across the table as they are on columns. For any other dimension, Tableau will start the calculation again. You can see, although grayed out, the Specific Dimensions are set to ‘Year of Order Date’.
But what if my Compute Using is not so straightforward? What if I want to have WINDOW_SUM(SUM([Sales])) for Year and [Sub-Category] only to compare this to the [Sales] by [State], [Category], [Sub-Category] and Year? The cells I’m trying to sum are not adjacent to each other, so my window for the Table Calculations is different to the available visible ‘windows’, namely Pane and Table:
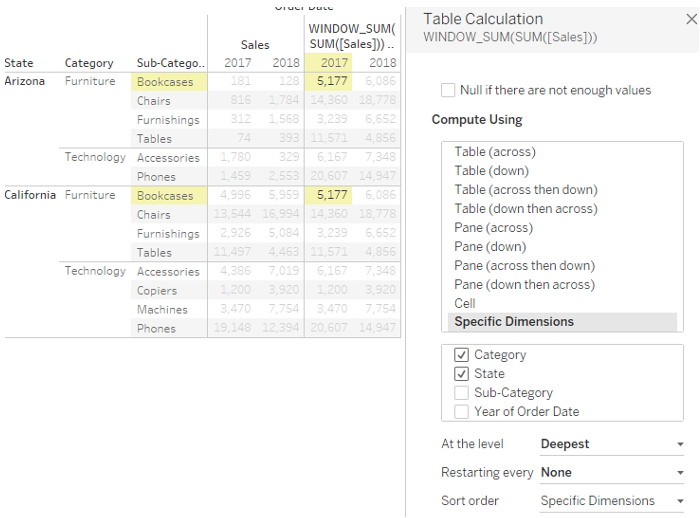
In this case, I need to specify the dimensions manually. Since I want my total by Year and [Sub-Category], I need Tableau to Compute Using [Category] and [State]. I often find this a bit confusing because basically I want Tableau to act like these dimensions are not in the view and ignore them. However, if you think of it like this, it seems to make more sense: Tableau, sum up my sales Across [Category] and [State] for every [Sub-Category] and Year.
The Specific Dimensions option is also handy when one or more dimensions are not on your Columns or Rows but only on Detail. If I need to calculate the average of SUM([Sales]) by [Product Name] within a [Category] (without using an LOD), I could do that by dropping [Product Name] on Detail, so I don’t actually have to show all Product Names, and then Compute Using Specific Dimensions and tick [Product Name]. However, you’d normally end up with lots of repeated values since Tableau will still show the WINDOW_AVG for every [Product Name] when on Details instead of Columns or Rows, even though the value is the same for every [Product Name] within each category.
There are a couple of ways to sort this, with the easiest one creating a simple calculations FIRST() = 0 and drop that on the Filter shelf. Ensure your Compute Using is [Product Name], just as with the WINDOW_AVG, since you want to calculate across [Product Name] for every [Category], and this will basically keep the first mark for every category. Since it’s just repeating the same values for every [Product Name], keeping the first one is just fine:
Sort Order
Finally, there are three other options you can change in some of the table calculations when selecting Specific Dimensions as your Compute Using setting, namely At the Level, Restarting every and Sort order. Let’s start from the bottom upwards with Sort Order, as this is the most commonly used option of three.
Let’s assume you want your cumulative Sales by year, and you go for a RUNNING_SUM of SUM([Sales]) to get this. This would normally be fine, and you can select either Pane (down) or Specific Dimension and select your Month dimension. However, what if you want – for whatever reason – to do a reverse cumulative Sales:
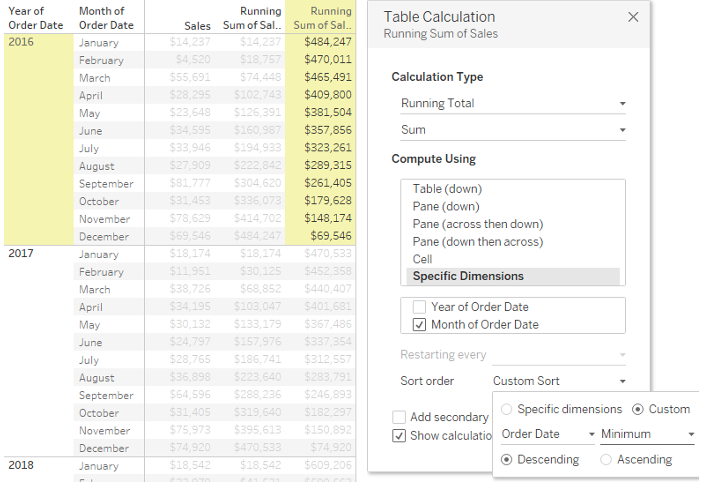
This is where the sort order comes in. I’ve selected Specific Dimensions and my Month dimension to ensure the RUNNING_SUM runs across Month for every Year. Then I changed my Sort Order to Custom, selected [Order Date] and an aggregation of this. You need to select an aggregation, as Tableau needs to aggregate the Sort field to the level of detail of your view prior to sorting. I’ve selected Minimum, but Maximum would do fine as well – you basically tell Tableau to sort your Table Calculation on the Minimum (or Maximum) date for every mark, and in this case, it would sort it based on the first (minimum) date (usually the 1st) for every month. Count or Count Distinct are also available options, but that would just sort it by the count (distinct) of row-level date values (days) for every mark, meaning February will always be the lowest and in this case wouldn’t make sense.
Now, finally it’s important to sort Descending for this specific exercise, as we want to sort from the Latest Minimum date for every year first – which is probably the 1st of December for every year. You can see, the sort order in the view stays the same but is reversed for the Table Calculation and starts with the cumulative total for every year in January:
At the Level
Now, onto At the Level and Restarting every. You would normally not need to use these options because the impact of this is subtle. However, when we look at the Specific Dimension option, you can either select or deselect a Dimension and change the order of the Dimensions. The order basically defines the default sort order, starting from the first Dimension. Having a Dimension selected means that Tableau will use this Dimension to calculate your table calculation across, whereas not selecting a dimension means it will form part of the partition. So in the prior example, Year is the Partition and Month is the Across Dimension. In other words, the calculation will reset when a new year ‘Partition’ starts, but within the partition the calculation runs across the months.
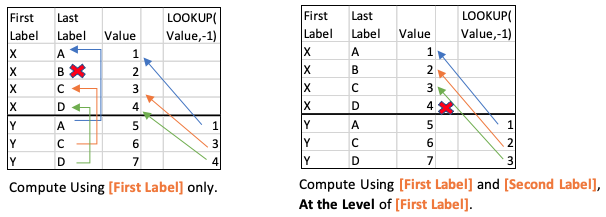
At the Level will basically do the same thing as deselecting the dimension(s) below the At the Level dimension. The default is deepest, which is (confusingly) the same as the last dimension in the list – selecting deepest or the last entry doesn’t change a thing, but if you select another dimension, you’re basically ‘deselecting’ the dimension below that one within the Specific Dimensions hierarchy. The subtle difference is whether we are either using exact (dimensional) values or the position within the table:
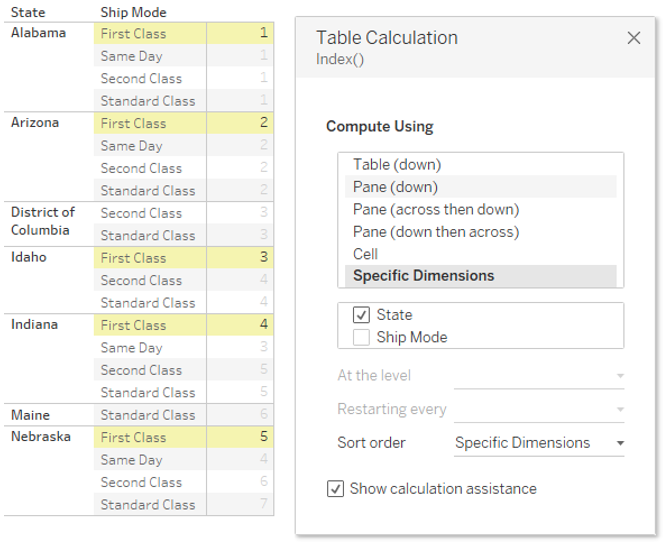
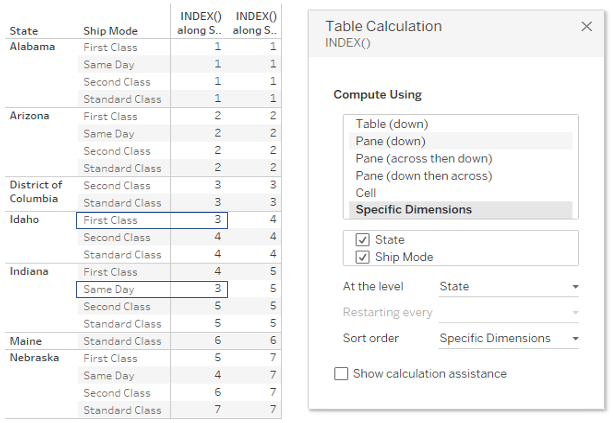
Let’s move onto some Tableau examples. I’ve got a really simple table showing [State] and [Ship Mode]. I want to add an Index to uniquely reference each state regardless of [Ship Mode] So I add a simple Index() calc to my table, select Specific Dimensions and deselect [Ship Mode], leaving only [State] selected. This doesn’t give me my desired results. Why? Because not every state has data for every [Ship Mode]. Because D.C. hasn’t got First Class, First Class in Idaho gets an Index of 3 whilst it’s actually the 4th state in my data. This isn’t what I want. I want every [State] to have a unique index, regardless of whatever goes on with the [Ship Mode]:
Now let’s change this a little bit. First, I select both dimensions, which basically tells Tableau to Compute the index down the Table. Then I change the At the level to [State] and boom! It’s doing exactly what I want and basically ignores the Ship Mode:
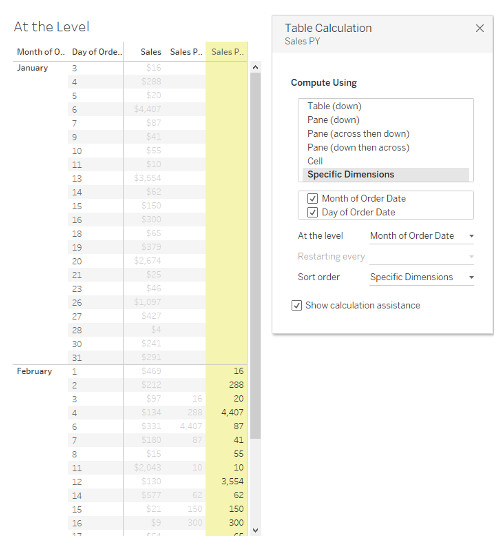
Let’s try a different example. I’ve got my [Sales] for the first two months of 2016 by day. I want to do a LOOKUP to compare the [Sales] by day across the two months – not based on the date but based on the day within the month on which we had sales.
However, there isn’t data for every day; for example, the first two days of January are missing, as well as some other days. So let me use this simple LOOKUP: LOOKUP(SUM([Sales]),-1). First, I calculate this LOOKUP with Year and Month selected and I leave the At the Level and Restarting every alone. The first two days in February, as well as some random other ones, stay blank as there isn’t an equivalent day within the month in January in my data. Secondly, I reuse this LOOKUP and leave all dimensions ticked. Then I select my Month dimension in At the level’ and boom! Instead of looking up the same day, it’s looking at the position instead, regardless of actual day number.
Restarting Every
Finally, Restarting Every. Normally, you’d say your deselected dimensions define your partition, window or when your table calculation should restart. For example, if you want a running calculation that only restarts every year, you deselect Year. Let’s say you want a RUNNING_SUM with a different sort order than my normal order of months; I want a cumulative total in order of month from lowest to highest SUM([Sales]). Okay, I set a custom sort order based on SUM([Sales]) ascending.
Now, because our year is defining the partition and therefore deselected in my Specific Dimensions, the year is ignored in the sort order. So the sort order is actually defined by the sum of sales by month without considering year if we deselect year. Whereas our view shows the cumulative SUM([Sales]) by month for every year, our sort order is actually defined by the (non-cumulative) SUM([Sales]) by month regardless of year, so every month in our sort order ‘list’ is the total across the years in our view. This doesn’t make sense at all.
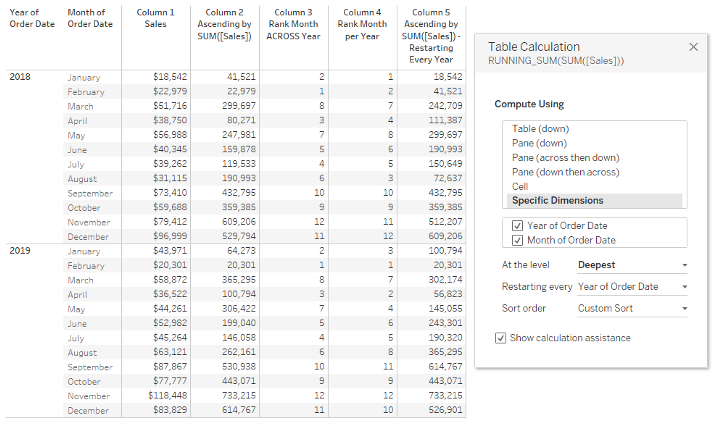
In the screenshot below, you can see in the first column that in 2018 our lowest ranking month is January and the second lowest is February then August etc. So you would expect the RUNNING_SUM to start with January, and the value for February should be January + February, whereas in actual fact (see column 2), the value for January is already January and February, and for February it’s only February, suggesting the Sort order to start in February, then go to January and then actually April (Jan + Feb + Apr) instead of August. Huh?
If we do a RANK(WINDOW_SUM([Sales]),’asc’) to rank the totals each Month regardless of Year, we can see what is happening (column 3). So the sort order of the RUNNING_SUM ignores the Year. The WINDOW_SUM is Computed Using Year and the RANK is Computed Using Month.
Let’s add a Simple Rank that Computes Using Month to see what the order should be for every year individually. This is in Column 4. Now, let’s fix our RUNNING_SUM by changing our Compute Using to both Year and Month, and changing the Restarting Every to Year to ensure Year is included in the sort order, since it’s part of my Specific Dimensions – see column 5:
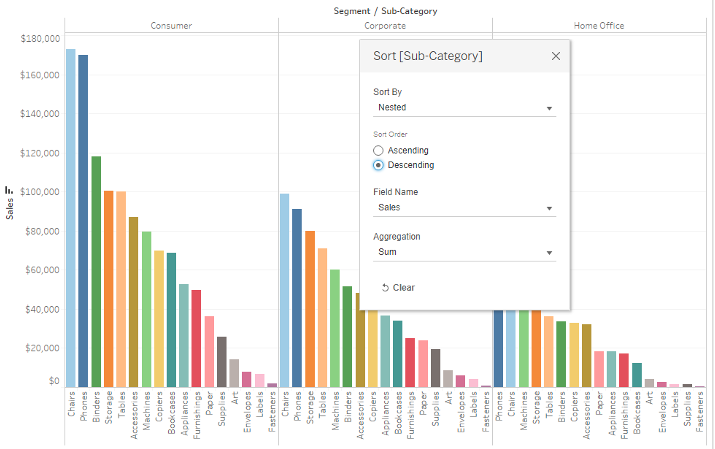
The default behaviour in Tableau does make (a little bit of) sense. If you sort normally with nested dimensions, the sorting will be based on the right-most dimension in isolation; otherwise, the order of values would differ across your higher order dimensions. The view below is sorted based on SUM([Sales]) by [Sub-Category] and clearly within the Consumer [Segment], the first [Sub-Category] is not the best-selling one, but overall it is. The same logic is applied when using the Custom Sort order with Table Calculation:
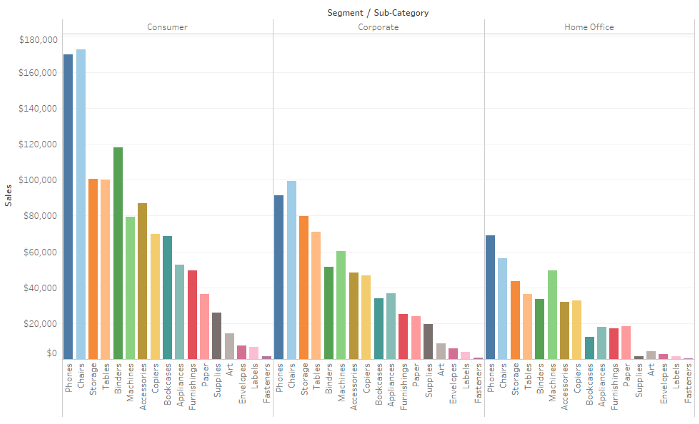
Can I break this behaviour outside a table calculation as well and basically have a different order of [Sub-Category] for every segment? Yep. You can by using Nested sorting, which ensures a sorting on [Sub-Category] within every [Segment]:
Keep in mind that if a dimension is deselected in the Specific Dimension list, Tableau will not consider it in your Sort Order at all. To ensure Tableau does actually consider the dimension in your Sort Order, keep it in your Specific Dimensions and use the Restarting Every to control your partitioning instead.
Conclusion
That wraps up our mini blog series about table calculations. If you’re interested in more Tableau support, explore our other blog posts or reach out to our team of experts. We’d love to come alongside you and help you make the most of your data!