
Table calculations are a special group of calculations in Tableau that apply to the values that are currently in your view or viz, and they do not consider measures or dimensions filtered out of the view. These calculations are only applied after almost everything else has already been done, like filtering, aggregating and calculating.
Essentially, table calculations use the data in your current view/ viz/ crosstab as data source, instead of performing calculations on the row level of your actual data source. Examples are running totals, moving averages, rankings, percentages of total and percentages’ difference between different marks such as year-on-year differences.
The Flexibility of Table Calculations
Prior to level of detail calculations, table calculations could be used to mimic the current exclude (or fixed) LOD behaviour. You could (and still can) use a WINDOW_SUM or WINDOW_AVG to sum up your data to a higher level of aggregation than the level of detail in your view. This allows you to create part-to-whole comparisons, like comparing county or state to the whole country or ‘double’ aggregating your numbers, such as averaging my sum of sales by county/state. We can now do that with LODs, so we don’t need to have everything on the lowest level of aggregation in view and then use table calculations to aggregate it to the level we need.
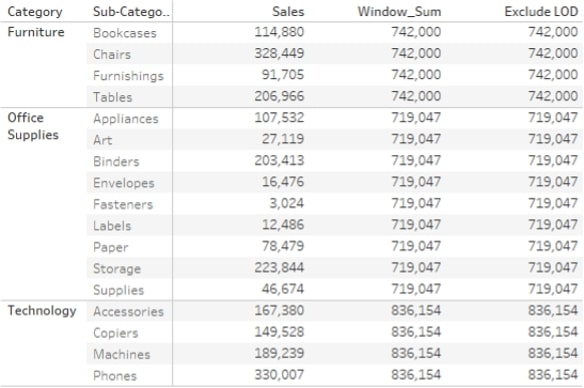
That doesn’t mean this type of table calculations is not useful anymore. If you want to show a granular level of detail with subtotals to compare, WINDOW-type table calculations can be more performant than an LOD, since all the data you need is already in your view. In the example below, I did WINDOW_SUM(SUM([Sales])) along the pane (I’ll explain this later), as well as SUM({EXCLUDE [Sub-Category]: SUM([Sales])}) LOD to compute my sales on Category level whilst keeping Sub-Category in view. The LOD took 0.2 seconds, whereas the WINDOW_SUM took <0.1 second according to the performance recording:
Where WINDOW calculations can be replaced by LODs where appropriate, other table calculations cannot. These table calculations are more of a ‘compare this mark to another or the previous mark and do something with that information’ type of calculation instead of moving up your level of aggregation.
The Fundamentals
Since table calculations are applied to what is currently in your view and not to the row level data of your data source, they can only be applied to aggregate measures (or dimensions) to ensure they are at the level of detail of your view.
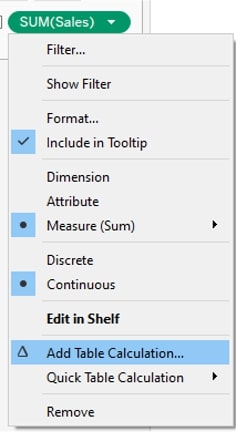
There are a couple of different ways to create a table calculation. First, you can create some of the ‘default’ table calculations by right-clicking the (aggregated) measure you want to apply the table calculation on and click Add Table Calculation. This will open the Table Calculation window in Tableau:
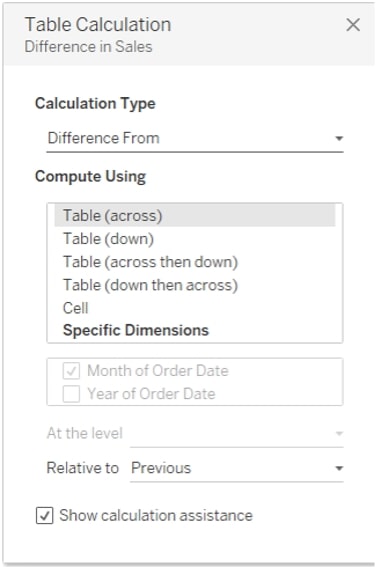
Here you can select the default table calculation such as Difference From, Rank and Percentage of Total. You can also select the Compute Using scope and direction. More about that in a bit:
There are also Quick Table calculations, such as Running Total or Year Over Year Growth. Selecting these will not open the Table Calculation window, but they will be applied immediately and can be customised later. Tableau will apply scope and direction itself based on what seems logical; for example, for Year over Year Growth, Tableau will compare the current year to the previous regardless of if Year is on Columns or Rows. It will also repeat this by default for every other dimension – for example, month. In other words, Tableau computes it across YEAR for every MONTH. I can, however, right-click this Quick Table Calculation and edit it to become a Month over Month growth for every YEAR if I want, or even a reverse Year Over Year Growth.
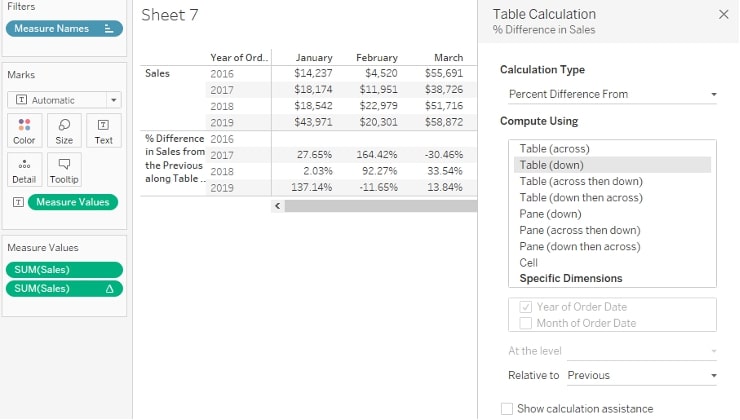
As you can see here, when you edit your Quick Table Calculation, the Table Calculation window shows up as well. Quick calculations are based on ‘default’ table calculations. Here, you can once again change the direction and scope. Again, I’ll explain a bit more about this in a bit, but if I was to change this from Table (down) to Table (across), the calculation would result in Month over Month growth for every Year. Or if I was to change the Relative to selection to next, I would get a reverse Year over Year Growth (comparing the current year sales to next year):
The third option to create a table calculation is by creating a calculated field. If you have created a table calculation through right-clicking a measure and selecting Add Table Calculation or by creating a Quick Table Calculation, you can click and drag the Table Calculation into your Data pane to add it as a (reusable) calculated field. You can also edit the calculated field like any other calculated field. So, let’s have a look at the Year Over Year Growth table calculation when dragged into the Data pane as a new calculated field:
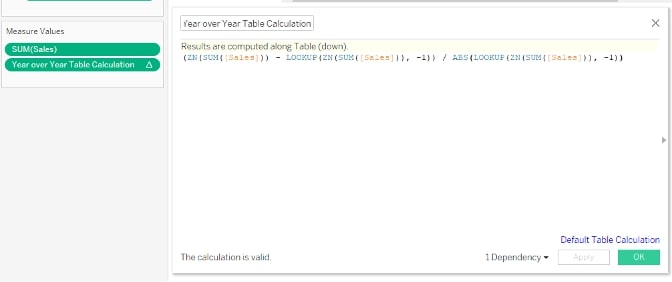
The actual calculation behind this Quick Table Calculation is pretty straightforward – ([New] – [Old])/ [Old] – the basic calculation that calculates % change over time. The LOOKUP function is the actual table calculation here and it tells Tableau one cell back for my [Old] value. If I was to change this offset value to -2 without changing anything else, my calculation would change to show % change compared to two years ago. If I was to change it to 1 without the minus, it would change into a reverse Year Over Year Growth. Note that you cannot change the direction or scope within the calculated field, as they are dependent on what’s actually in the view.
Direction and Scope
Let’s dive into this Compute Using section on the Table Calculation window. This defines the direction of the table calculation and the scope. I’ve still got the Year Over Year Growth calculation in my view, but I want to see this by [Category], so I need to add this field into my view. The initial result is this:
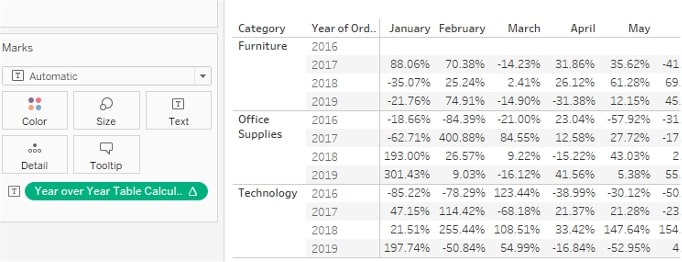
The calculation still works as configured going down the table. However, I also want the calculation to restart every Category for obvious reasons. There is no point comparing 2016 Office Supplies to 2019 Furniture Sales. If I was still using the Quick Table Calculation, Tableau would do this automatically since it’s a bit more context aware, but since I’ve copied the table calculation into a calculated field, I now need to manually adjust it:
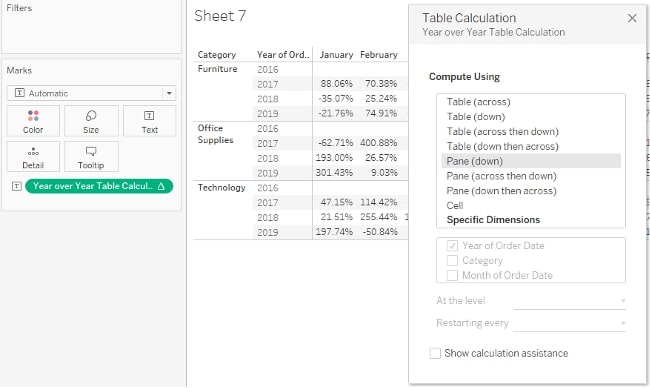
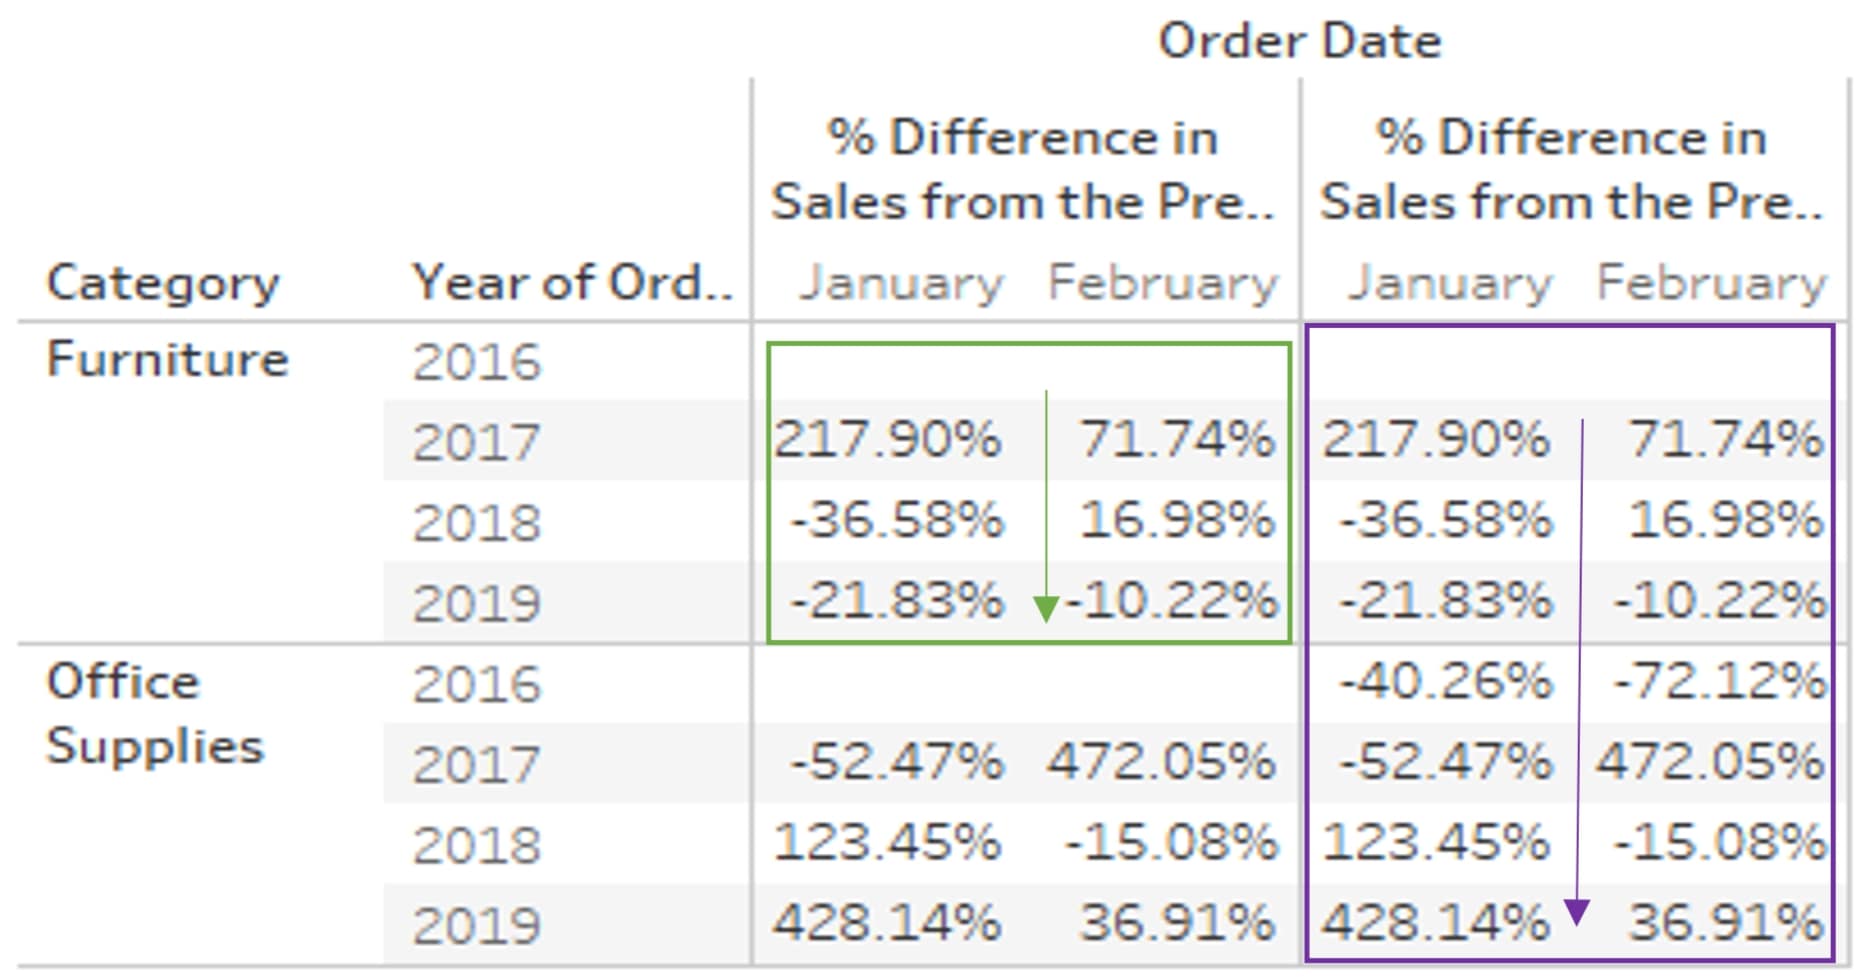
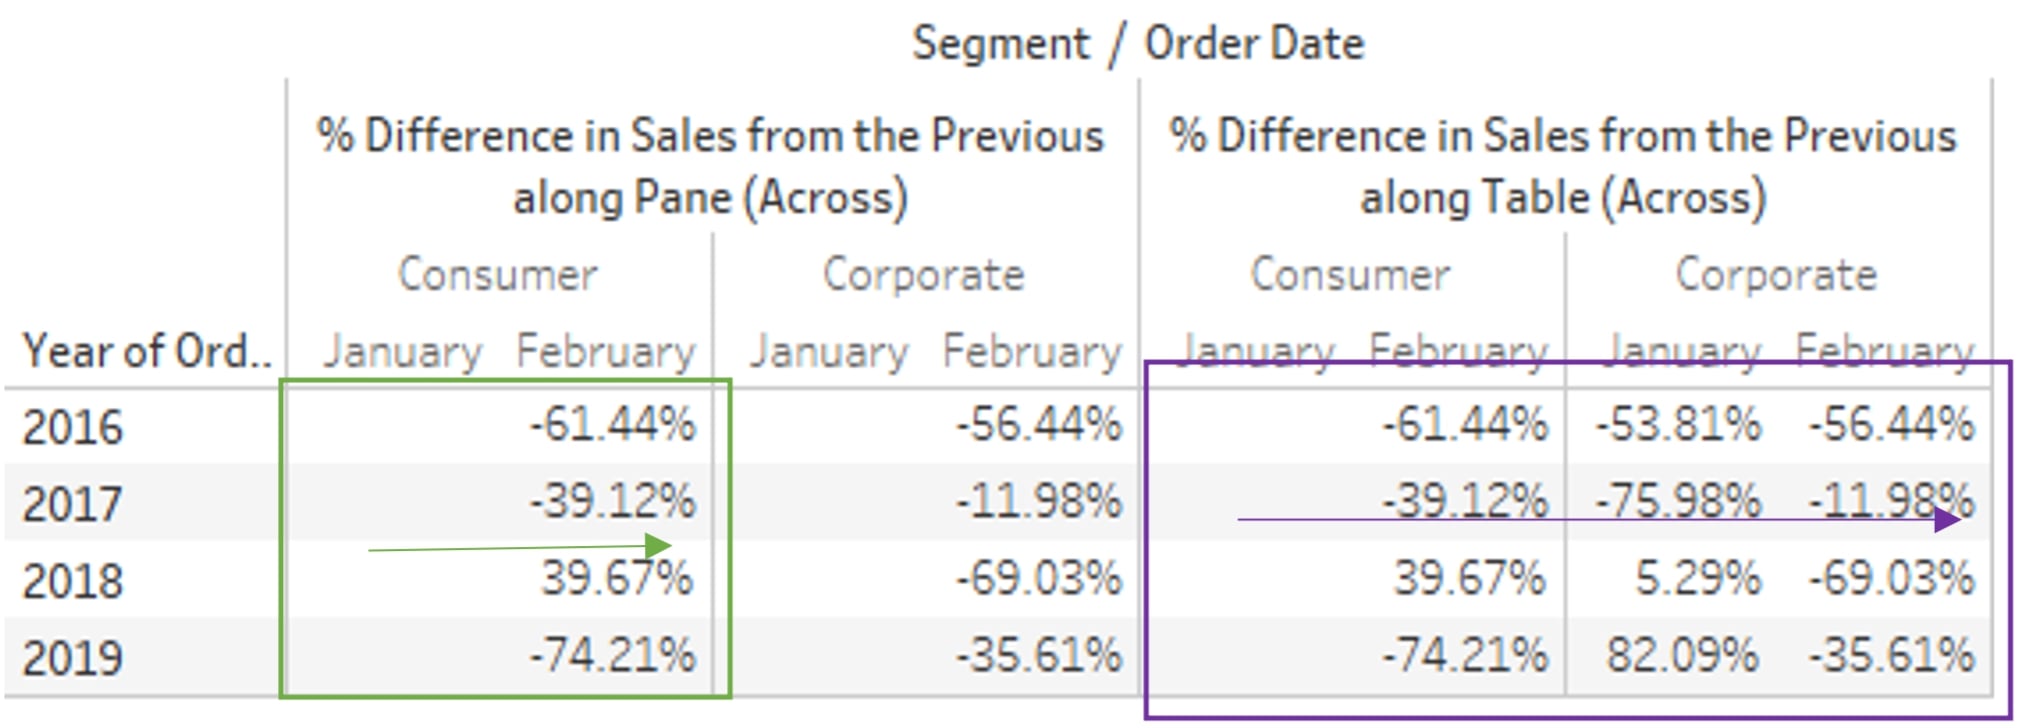
When I change the Compute Using to Pane (down), it does exactly what I need. The table calculation now restarts every Category and every month, and only Year is used to compute across. The pane is defined by all dimensions on Rows and Columns except the rightmost one (in this case, Year). If I was to add [Segment] to the Columns shelf before Month, a single pane would consist of all values across Years and Months partitioned by [Category] and [Segment]. In this example, the green square is the pane, and the purple square is the table. The first table calculation is computed using Pane (down). It restarts every Pane, as well as every month within the Pane. The second table calculation is computed using Table (down). It restarts every month within the table but continues across [Category]:
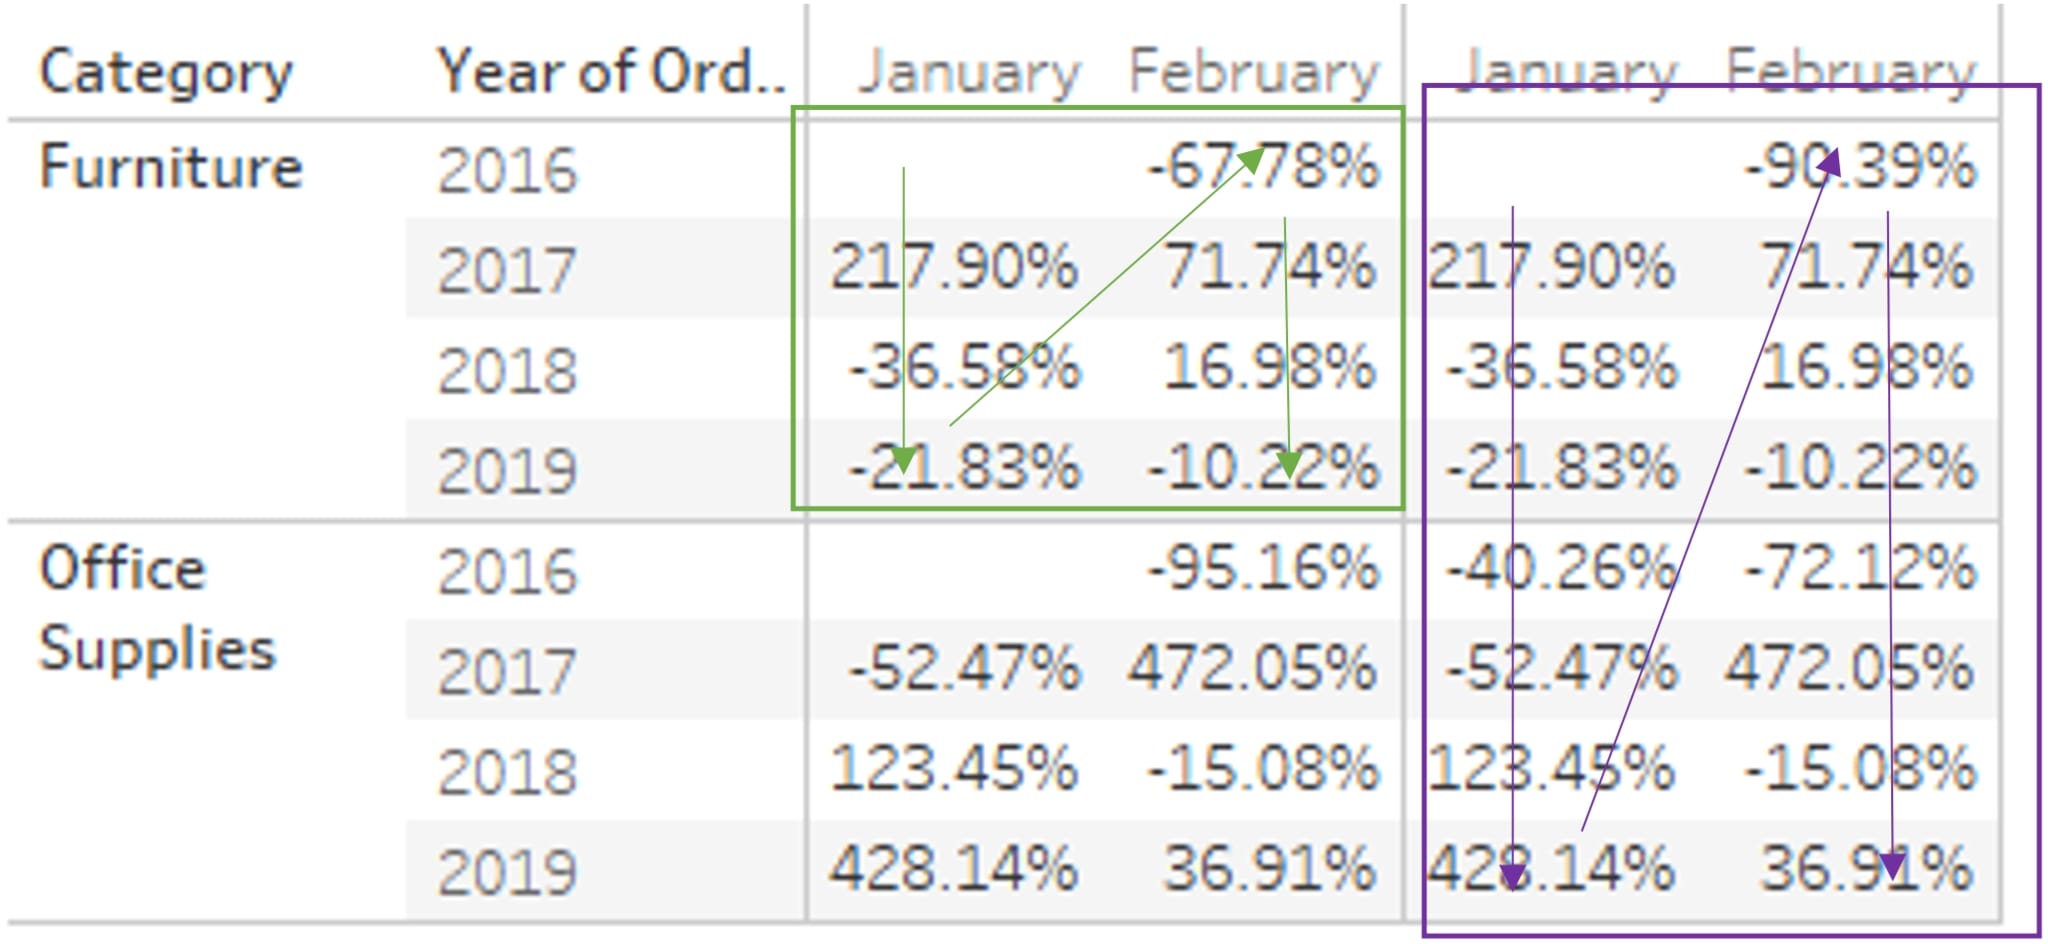
In the next example, I’ve removed [Category] and added [Segment] across columns. Again, same table calculations, but they are now calculated Pane (across) and Table (across). The difference is Pane (across) restarts every [Segment], whilst Table (across) continuous across [Segment]:
Next would be down and across for both Pane and Table. The effect is the same as down for both, but the calculations do not restart every month. The first value for the next month is compared against the last value for the previous month either within the pane, so split by [Category], or across the whole table:
And then there are across and down for both Pane and Table. Again, similar to across but continuing across years and restarting every [Segment] for Pane only.
Compute using Cell is usually only relevant when you disaggregate measures and want to run your table calculation across all underlying values. This is rarely used, so I’ll skip over the Cell compute using here.
More Table Calc Insights to Come
When your scope and partition isn’t as clearly defined as a specific ‘window’ within your view, and a clear direction in which the table calculation needs to run (for example, when your window is scattered across different panes and your direction jumps from pane to pane), you can use Specific Dimensions to enable advanced options. I’ll cover that later in this blog series, so be sure to check back next week for a look at other capabilities and more advanced options for table calcs!