
In this series, our team unpacks how to boost user adoption of Tableau Server through strategic planning, enablement and quality control.
So, your organisation has Tableau, but rather than the calm pastures of structure, knowledge, teamwork and clear processes, it feels a lot more like a chaotic free-for-all. Well, you are in the right place. In this blog, we are going to look at what’s often going on when things feel like the Wild West, as well as five quick wins to help turn things around.
Quick Win 1: Sites and Projects
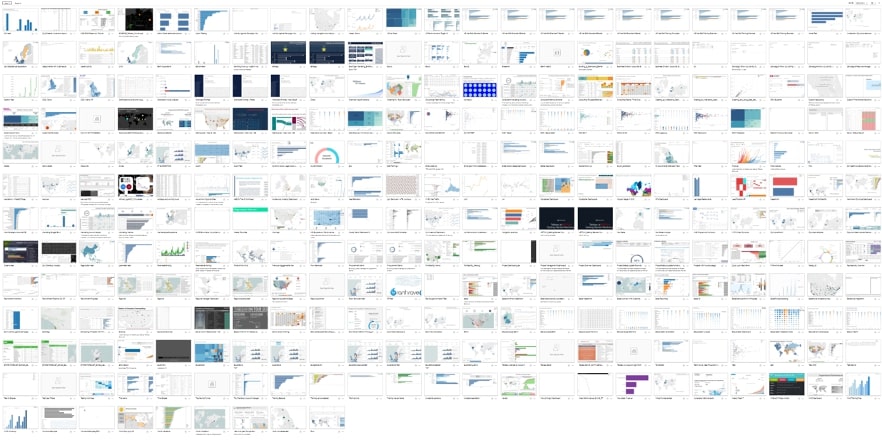
Some organisations I have worked with make my head spin before I’ve even looked at a single dashboard. Hundreds of chaotic projects dumped into the same place with endless workbooks named dashBoard.final, dashboardv2-Finalv7.final_V4 and Dashboard_promise.this-is_the.last-onev971 and so on!
Turn something like this:
Into something more like this:
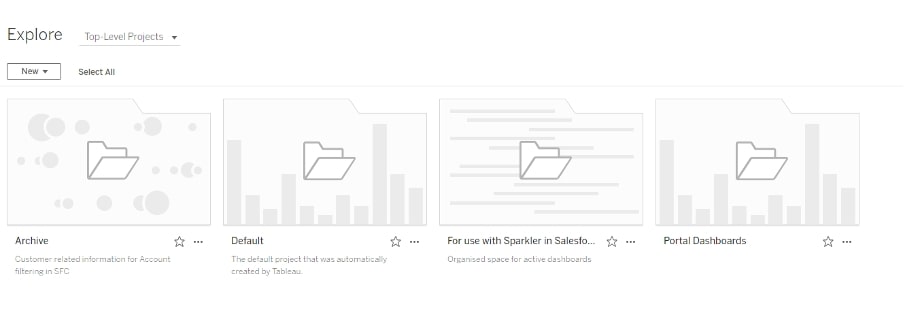

Sites
This is less a Tableau hack and more just about your approach to process and organisation. With Tableau, you can create as many sites as you want for free, and when you log into Server or publish to it, you are forced to choose a site. Access to sites can be managed (see more on permissions below), and this can be a great way to keep things carefully compartmentalised in sensible areas. Unfortunately, sites are not available with Tableau Online, but you can still use projects and permissions to create a similar effect.
Projects
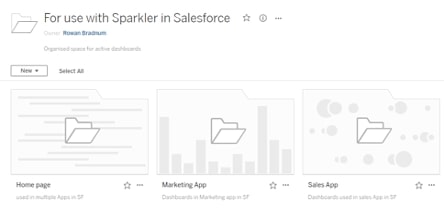
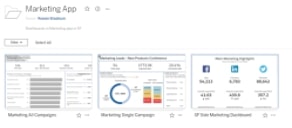
Sites are then broken into projects (like folders), and you can have as many sub-projects and as much nesting as you need. How you choose to break things up is entirely based on your needs—by department, by stage (development, QA, production), by client, by product, etc. Keep in mind, though, that your process and your system need to work for development and consumption*. For example, the organisation needs to work for viewers coming in to find the dashboards, as well as for developers making and publishing them.
*The exception to this is to use your server for development and then have a Curator instance for displaying them.
Quick Win 2: Version Control, Favouriting and Tagging
Version Control
Although you can store a lot on Server, this is not what it is designed to do best, and best practice is always to use the right tool for the right job. Rather than publishing up a new version every time you make a change, publish over old versions. Then, if you need to go back to an older version, you can use revision history (see the image below). Another tip: I tend to name things with the suffix WIP to show they are still in progress until they are ready to be consumed:
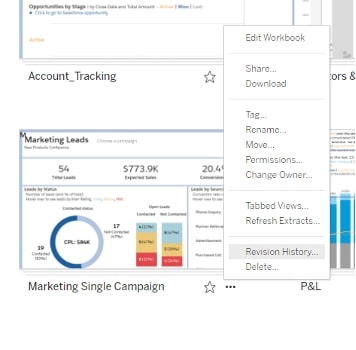
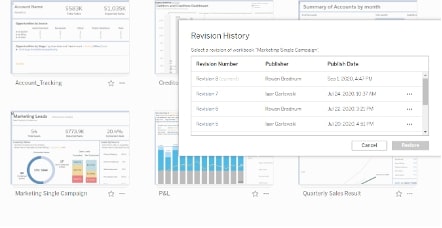
These might seem like small simple fixes, but these changes can make a world of difference in clearing up the mess.
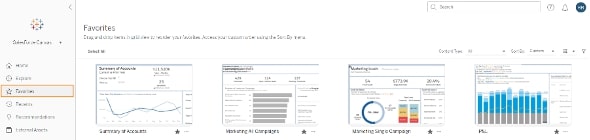
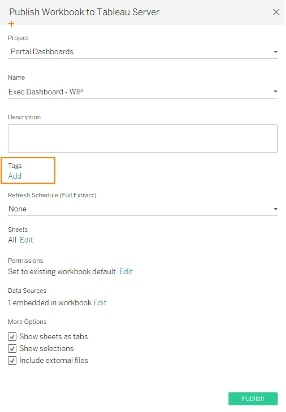
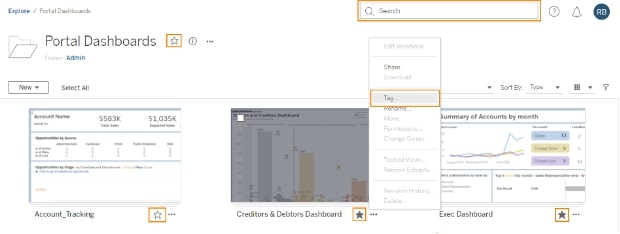
Favouriting, Tagging and Searching
I have found that a surprising amount of clients aren’t aware of these simple functions that are intuitively built into Server. I find this strange because we are so used to searching and favouriting in our browsers and a range of other contexts, but a lot of people do miss it here. So, even if you have seen these before and use them regularly, make sure the rest of your organisation are just as clued in! Additionally, having clearly communicated processes for tagging relevant information, such as team, department or company project (initiative), when publishing a workbook can be a big help when people need to search a workbook:
Quick Win 3: Permissions
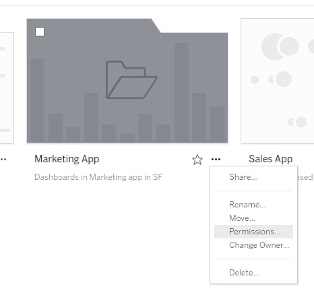
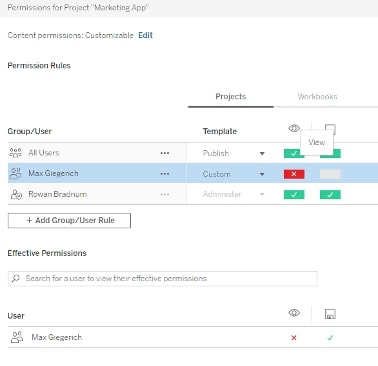
Tableau Server gives you a lot of permissions (Igor goes into more detail here), but the important one for clearing the landscape is viewing workbooks and projects (which are like folders). Unless there are very few Tableau users and they are all in the same team, you are not going to need to see every dashboard that is ever built in your organisation. In addition to this, removing permissions to view a project does not have to mean a user cannot access the workbook; they can’t find it by exploring, but they can still be sent the link to access it.
Creating user groups for the different teams in your organisation and only having the needed projects/workbook visible can drastically reduce the chaos. Have a look at Igor’s blog or this webinar on Tableau Server for Data Consumers to find out more on how to do that. For example, did you know you don’t have to be a server admin to set permissions on projects you are in charge of?
Quick Win 4: The Administrative Load
A lot of companies’ approaches to administration and anything IT-related is to give one or two people the whole lot to do. There is some management you definitely want to keep to one or two IT experts; however, a lot of administration is really simple and can be disseminated through the company. Tableau Server is intelligently designed to support this and can be easily leveraged to give the right people the right power.
For example, did you know a user can be made a site administrator for one site, and this doesn’t require any additional licensing? This means if you have a site only for marketing dashboards, someone with a little bit of Tableau Server training in the marketing department can manage all the permissions for the projects and dashboards in that site, as well as create users and user groups.
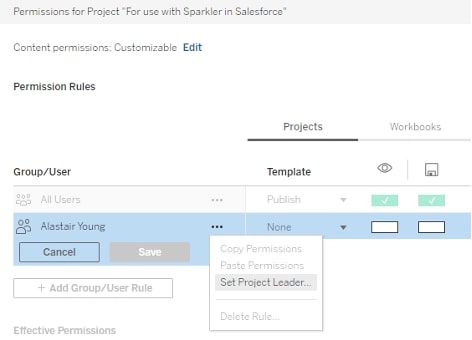
You can get even more granular in the administration by making someone a project leader. A project leader is able to set permissions and have control over a single project but does not have the ability to create users or user groups. This means that cleaning up obsolete dashboards and shifting permissions can be done internally without having to wait on that (most likely) overloaded IT guy to get back to you:
You could also make the server administrator a lot happier by giving them the right tools for the job or outsourcing the server-specific support. In terms of monitoring the server, this can be made easier by manually creating dashboards using the repository data the server automatically generates. Alternatively, InterWorks offers a suite of dashboards that just does this as part of our Platform 360 package, which includes:
- Packaged Tableau workbooks with your utilization data
- Hardware and application log collection and processing
- Expert 360-degree analysis of your server environment
- Documentation of hardware/software environment and recommendations
In terms of outsourcing server management, one option is ServerCare by InterWorks. ServerCare is a service package that helps you manage your Tableau Server. It monitors the health and performance of your Server and supports you in hosting; analysing and applying business intelligence insights; and charting a course for the future of your data practice. The ServerCare team focuses on the behind-the-scenes processes, so you can spend your time on your data.
Quick Win 5: Display Dashboards Outside of Server
One of the major drawbacks of Server is being forced to set up the organisation to work developers and consumers simultaneously. This is one of the main reasons InterWorks developed Curator: to enable separation of creation, development, iteration and testing from display to consumption.
Formerly Portals for Tableau, Curator is a solution for embedded analytics from InterWorks that empowers you to take charge of the way data insights are organized, packaged and delivered. It helps you bring order to data chaos through user-friendly controls, navigation and filtering. Consistency and convenience is paramount with Curator as evidenced by its ability to enable users to view different dashboards with cohesive branding and all within a single web ecosystem. This puts ease of use and centralized convenience at the focus.
To learn more about Curator by InterWorks, visit the Curator website, peruse our industry-specific microsites or request a demo for your own organisation. Looking for support in another aspect of your analytics or more user adoption resources? Reach out to our team. We’d love to help.