
Shooting from the hip is great for western flicks and video games, but when it comes to managing your Tableau Server environment, the stakes are high and the costs of poorly informed decisions are even higher. As one of Tableau’s most prolific partners, InterWorks has seen the good, the bad and the ugly. That’s why our team has packaged our knowledge and experience into a new service we call Platform 360. No two Tableau Server environments are the same, and this offering addresses our clients’ need for tailored recommendations based on their own business requirements, infrastructure and Tableau usage.
Why a Customized Approach Makes Sense
Talk to one hundred businesses managing their own Tableau Server environment, and you’ll find one hundred different Tableau ecosystems. Each one is like an isolated world evolving within its own unique circumstances. They use different cloud services, approach data management differently and have their own habits and cultures surrounding Tableau. Some depend on live connections to data, while others exclusively use data extracts. One company may use Tableau to provide visuals to millions of external users, while another locks down their content for internal consumption only. On the infrastructure side, some environments support mission-critical efforts requiring highly available architecture; others operate comfortably with a single point of failure and don’t mind if the system is unavailable from time to time.
InterWorks has experience with all of the above. We understand how important it is to consider the entire context of a Tableau Server deployment in order to assess health, performance and identify the necessary steps to keep Tableau running smoothly for the teams depending on it.
To gain the perspective required to truly understand your Tableau ecosystem’s strengths and shortcomings, you need to know where to look. Our collective experience has provided us with strong mastery of Tableau ecosystems and best practices, and the Platform 360 service matches our know-how with your understanding of the business needs.
Platform 360: A Comprehensive Solution
The Platform 360 goes beyond tracking dashboard load times, usage statistics and other metrics readily available to Tableau site admins. Our approach shelves the cookie-cutter guidelines and recommendations in favor of collecting comprehensive data across your entire deployment. For at least two weeks, we record information related to resource utilization at the infrastructure layer, detailed Tableau usage that we can cross-reference against the resource utilization data, and system-level configuration settings.
After the data is collected, it’s time for a conversation between your team’s key Tableau stakeholders and our platform architects. This is when your team provides the context that will guide how our architects analyze the data. We want to know what your goals are, how Tableau fits into your business and any pain points you have within your Tableau ecosystem. This helps us identify your team’s priorities and puts us on the fast track to building an action plan to fine-tune your Tableau Server environment for optimal performance.
Following up on the initial discovery conversation, our teams reconnect to walk through the results, and we provide our recommendations.
Collaboration is Key
For the process to work, it takes two to tango. We provide your team step-by-step instructions on how to kick off the process, enabling us to collect the data that feeds into our analysis. From there, our team handles all the aspects of turning the raw metrics into useful data. Getting to valuable insights requires collaboration between your team and our platform architects. We listen to what matters to your team and tailor our advice and recommendations to optimizing Tableau Server accordingly. Once your team has those recommendations, the ball is in your court to make it happen. If you need help with that, we are happy to re-engage with you and get it done.
What You Can Expect
During the final Platform 360 readout, we provide a comprehensive document summarizing our key findings and recommendations. This includes an overview of the existing server topology configuration and hardware specs, our suggestions on how to improve those configurations, and performance visualizations for memory, storage, usage and network traffic. Where applicable, we drill into specific points of interest driving our recommendations.
To cherry-pick a few of the dashboards we use in our analysis (there are dozens of them), here are some sample visuals that help shed light on what is happening in your Tableau Server environment. The sources of these assets are Tableau workbooks we make available to your team as part of the service:
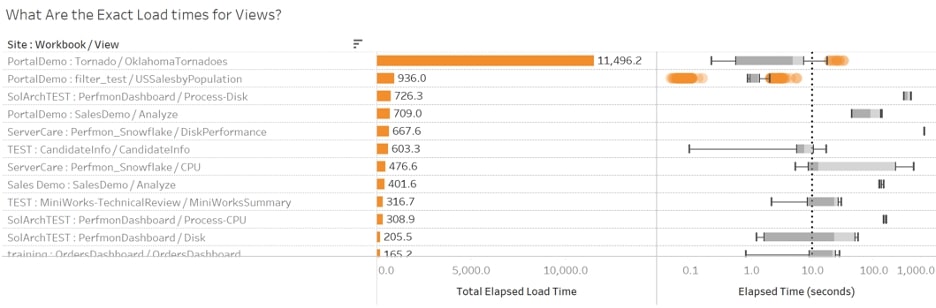
If Tableau Server were a movie, then View Load Times would be the star of the show. The longer the load times, the less happy your users. Our analysis involves several visuals like the one shown above, which allow us to dissect exactly what is happening on your server and how long those events take to process.
In this example, we can see that our userbase is addicted to a tornado dashboard. While a significant portion of time spent loading views is dedicated to a single view, we can see that the average load time for that visual is just a few seconds. Not bad!
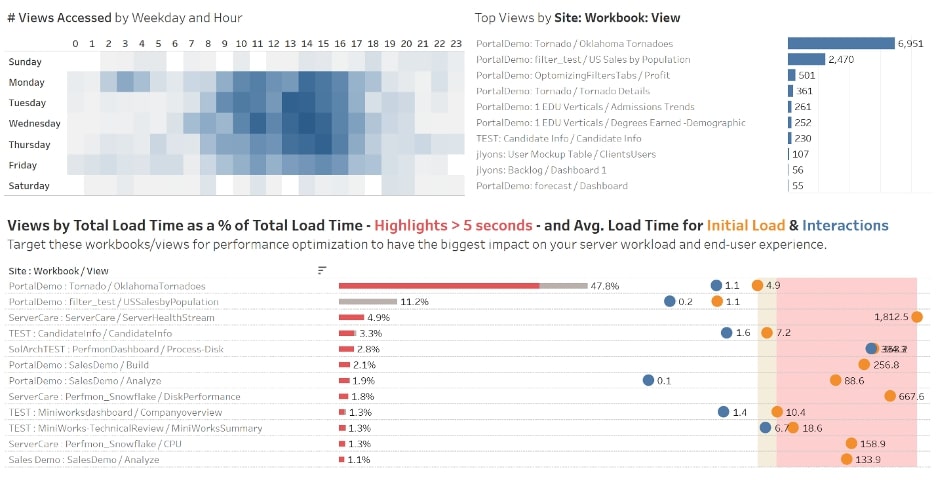
Other visuals we use to assess the views that users access on your server look like the one above. This one provides us some context as to when our userbase is poking around the server, along with the number of times specific views were accessed. Additionally, for each view, we can now compare initial load times versus interaction load times. Generally speaking, if interaction load times are high then our users are likely having a frustrating experience using content on Tableau Server.
Among other things, this can help us identify specific content that’s worth spending time optimizing. If 70% of your userbase is interacting with a view, and that view takes a few minutes to load anytime you modify a filter selection, improving the load times of that specific asset offers enormous potential to improve your team’s efficiency (and quality of life) across the board.
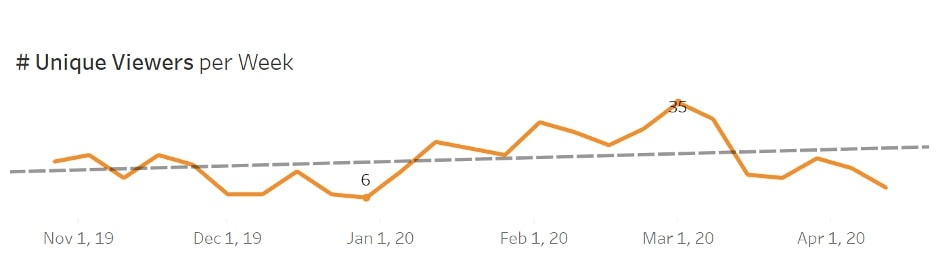
Speaking of your userbase, it is useful to know how many of your users are actually engaging with your dashboards on a regular basis. Our analysis includes several charts highlighting the number of overall users and when those users are active. The image above provides a glimpse into the unique viewer count, which is an excellent way to tell how active your userbase is over time. Perhaps every team member who is onboarded is given access to Tableau Server. But are those users actually interacting with your content?
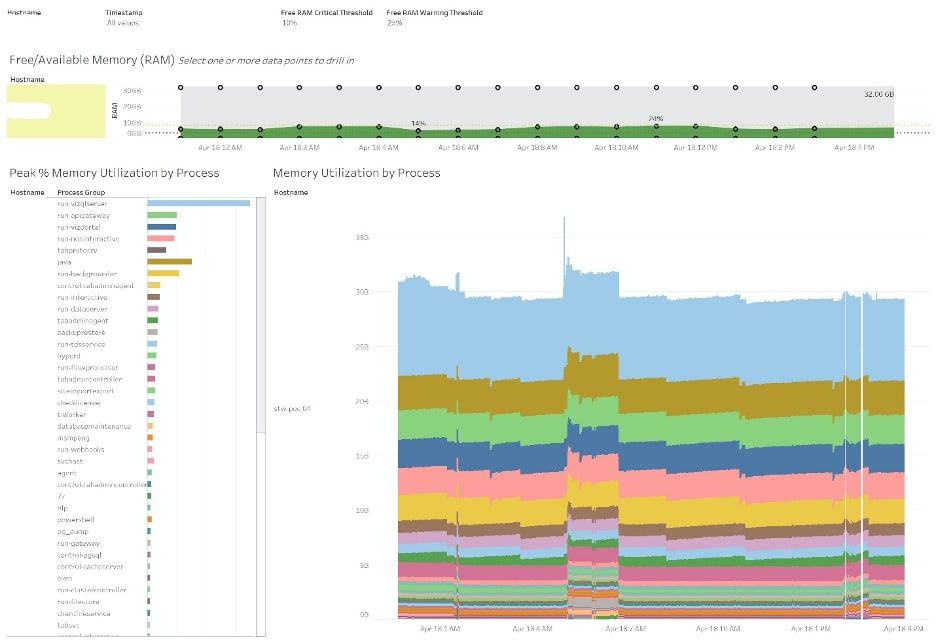
The visual above won’t be winning any beauty contests, but it is one of the visuals our clients tend to become fixated on when we connect to discuss their system performance. The reason for this is that RAM is at the heart of so much of what Tableau Server does. If your server runs low on RAM, that means visuals may be rendering slowly (or not at all) for your end users. If that happens, that is bad news.
These types of charts help us quickly identify points of interest where resources were scarce or where the hardware simply couldn’t keep up with the demand placed on it, and processes crashed. While they aren’t going to be the sexiest charts or infographics you’ve ever seen, these system-level performance metrics are absolutely crucial to evaluating whether or not your environment is capable of keeping up with the demands of your userbase.
See the Difference for Yourself
If you feel like you’re in the dark in terms of understanding your Tableau Server performance, there’s never been a better time to reach out to InterWorks and schedule a Platform 360! We have the process in place—all we need is the green light from your team, and we will start the data collection process. In a few weeks, you’ll be enjoying all the benefits the Platform 360 brings to your team. Together, we’ll make sure your Tableau Server environment has what it needs to meet the needs of your business.