
Since Tableau released 2020.3 on the 11th of August, it is high time to highlight some of the new or improved features. In this blog, I’ll highlight the following:
- Improvements to the New Data Model
- Improvements to set controls, both introduced in 2020.2
- The IN operator
- Predictive modeling
New Data Model – Join Calculations
Tableau introduced the New Data Model in 2020.2, adding new capabilities and flexibility when dealing with data sources through the introduction of relationships. When using relationships instead of joins, you prevent duplication of data and improve performance by context-aware queries. You can read all about the New Data Model in this blog from my colleague Eugenia Kis.
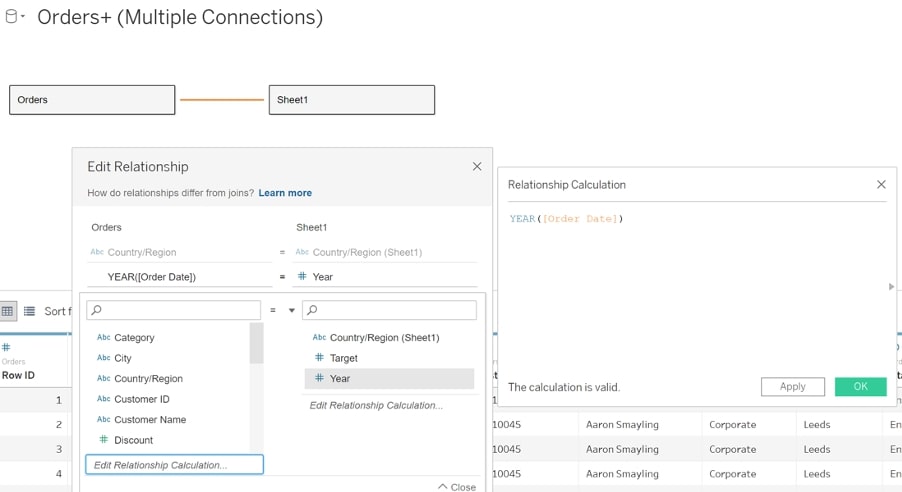
However, there is one little thing that made relationships tricky to use: no calculations allowed on setting the relationship. A quite common situation where you need multiple tables is when you work with actuals and targets. However, you are dealing with different levels of aggregation. Your actuals are on a transactional level, whilst you have a yearly target.
With joining (and blending), you can distill the date elements from your actuals to join (or blend) on year, but since the actuals are on a much lower level of aggregation, a lot of duplication happens in your target data. This means lower performance and the need for LODs to prevent duplications of your target data.
Enter Tableau 2020.3 and relationship calculations. Now, you can simply distill your year from the data in actuals to build a relationship with your target data:
IN Operator
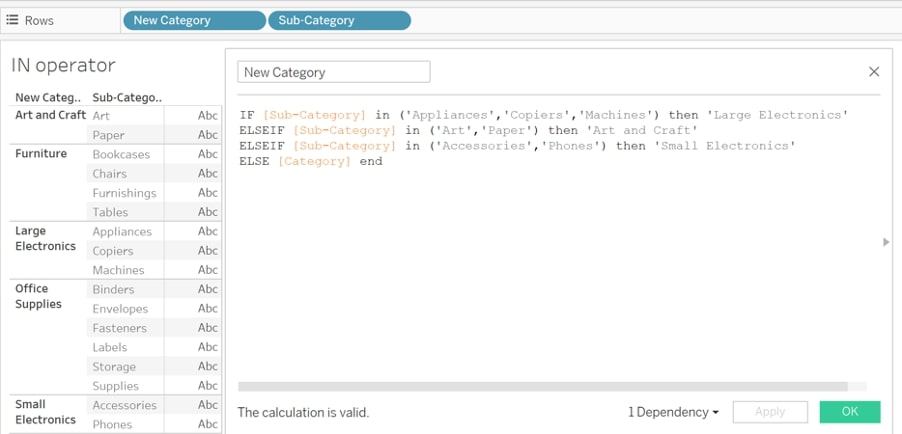
Tableau has (finally) introduced an IN operator for comparing values in calculations. If you are familiar with the SQL IN operator, you know what I am talking about. The IN operator has been a popular idea in the Tableau Community, with the most prevalent IN operator idea being eight years old and having nearly 8000 points, making it the 12th most popular idea.
In most situations in Tableau, you can use groups and sets to produce the same result as an IN operator in a calculation, but if things get a bit more complex and you want to reference multiple fields with multiple operands/values and nested calculations, the IN operator can be very useful. It will prevent you from having to create dozens of groups and sets and allow you to put everything in one (big) calculation:
Set Controls
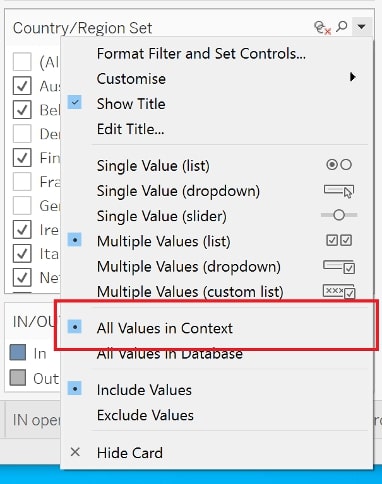
Tableau also introduced set controls in 2020.2, which allowed users to have more flexibility in comparisons in their visualisations and analysis. Set controls can be used in a similar fashion as quick filters, but your data is only added in or taken out of a set, not actually filtered. You can read all about set controls in this blog from my colleague Matt Whiteley.
In 2020.3, you have even more flexibility you can add or remove in the set controls. A context filter can now be applied to filter a set by simply right-clicking on the set controls and clicking All Values in Context:
Predictive Modeling Features
Now for something powerful and cool—Tableau has added predictive modeling features! I am not going to pretend that I am an expert in this area, but I will highlight them briefly and give my understanding of these new features.
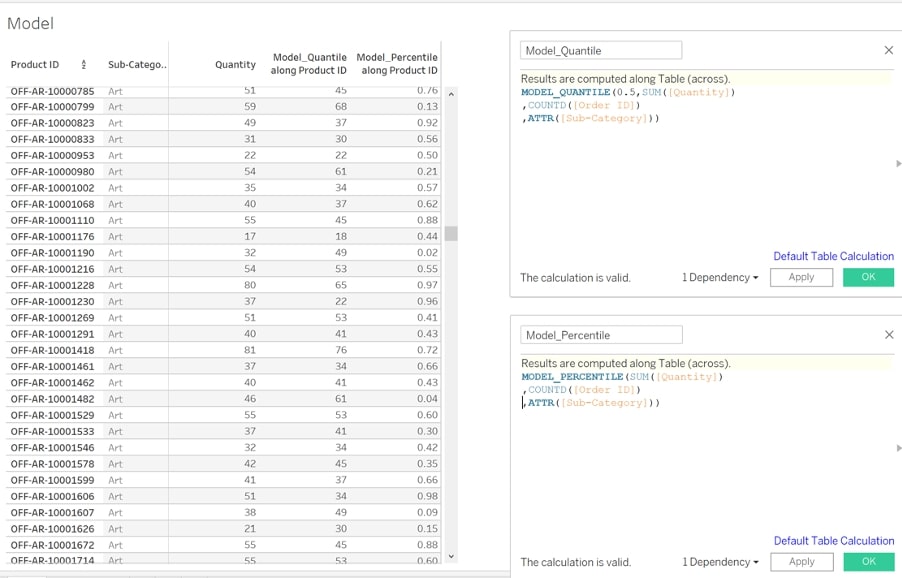
There are two new functions: MODEL_QUANTILE and MODEL_PERCENTILE.
The MODEL_QUANTILE returns a “target numeric value within the probable range defined by the target expression and other predictors, at a specified quantile.” In simpler terms, it calculates the probable range of values for an aggregated measure of your choice based on one or more other measures or dimensions (predictors) that you believe have an impact on your chosen measure. Since it is a range of values, you also need to specify the quartile to get a final, single target value. For example, 0.5 would be the median value out of the probable value range. You could use this to fill in future values or gaps or compare actual values with expected values. In the example I use, the MODEL_QUANTILE function gives me the median value of the predicted value range of the total Quantity sold by product, which is predicted based on the distinct number of orders, as well as the Sub-Category of the product.
The MODEL_PERCENTILE is essentially doing the same calculation as the MODEL_QUANTILE, but instead of giving you a single value out of the probable value range, it tells you how the actual compares to the probable value range in percentiles. For example, if the actual is close to the median of the probable range, the value returned will be close to 0.5 or, in simple terms, close to what’s expected. In the example, I am comparing the actual total Quantity sold by product to the probable value range as a percentile:
If you want to learn more about this, please have a look at the official Tableau help page on predictive modeling and over here for a clear example of how predictive modeling can be used.
I hope you enjoy exploring the new features and functionalities in Tableau 2020.3. Reach out to us here at InterWorks if there’s anything we can do to support you in your efforts.