
The release of Tableau 2020.2 came with a host of new, exciting features. The one I was looking forward to most was set controls and how they could improve existing sets to allow the user more flexibility on what is shown and compared in worksheets and dashboards. The first idea that came into my ahead was to create a dashboard with the functionality shown below:
I will do a walkthrough of this further down, but first, some context. The addition of set actions in Tableau 2018.3 really changed the game when it came to how we use the sets functionality. It gave us the option to click a mark on a chart to let us control what was in a set. Previously, actions were just used for filtering, whereas set actions places data into two groups—in and out—allowing us deeper comparisons and analysis.
Improving upon Set Actions with Set Controls
While set actions have been extremely useful since their release, there have been a couple of limitations. Firstly, selecting marks on a worksheet can sometimes be quite tricky if the area you are selecting is small in size. You also have to hold down CTRL when selecting multiple marks, so selecting the wrong one at any point means you have to click the white space and start all over again.
Now, thanks to the introduction of set controls in 2020.2, we no longer have to deal with either of these two things. The first way around this is that you can now show a set like you would a normal filter. This is really simple to set up:
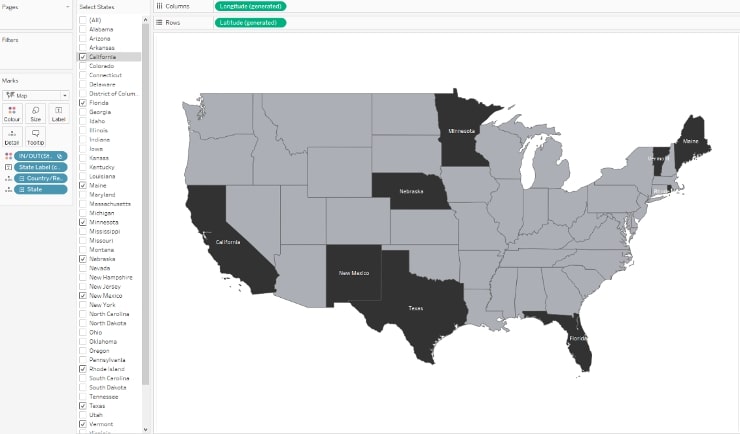
- Using the Superstore dataset, create a simple map of the U.S. by state. As we can see, using an action on this chart would make it difficult to select the smaller states in the east of the United States such as Rhode Island and Connecticut.
- Create a set by right-clicking on State and Create > Set. Drag that field somewhere in the view, such as Colour, and change colours to your preference.
- Right-click on that new field and select Show Set.
It will show in the same format as a traditional quick filter with the same single and multi-select options, as well as the ability to exclude and include. But instead of filtering the countries not selected, it is simply changing the colour to distinguish between those selected and those not:
The second feature I’m going to show is how we can now use set controls to improve set actions and create a dashboard like the one shown at the top of the page.
Previously, when we would run a set action, we would see the menu on the left. It gives you the option of how to run the action and what happens when you clear the selection. In this case, we would select the state in the view to add a value to the set and then click off the view to remove all the values from the set:
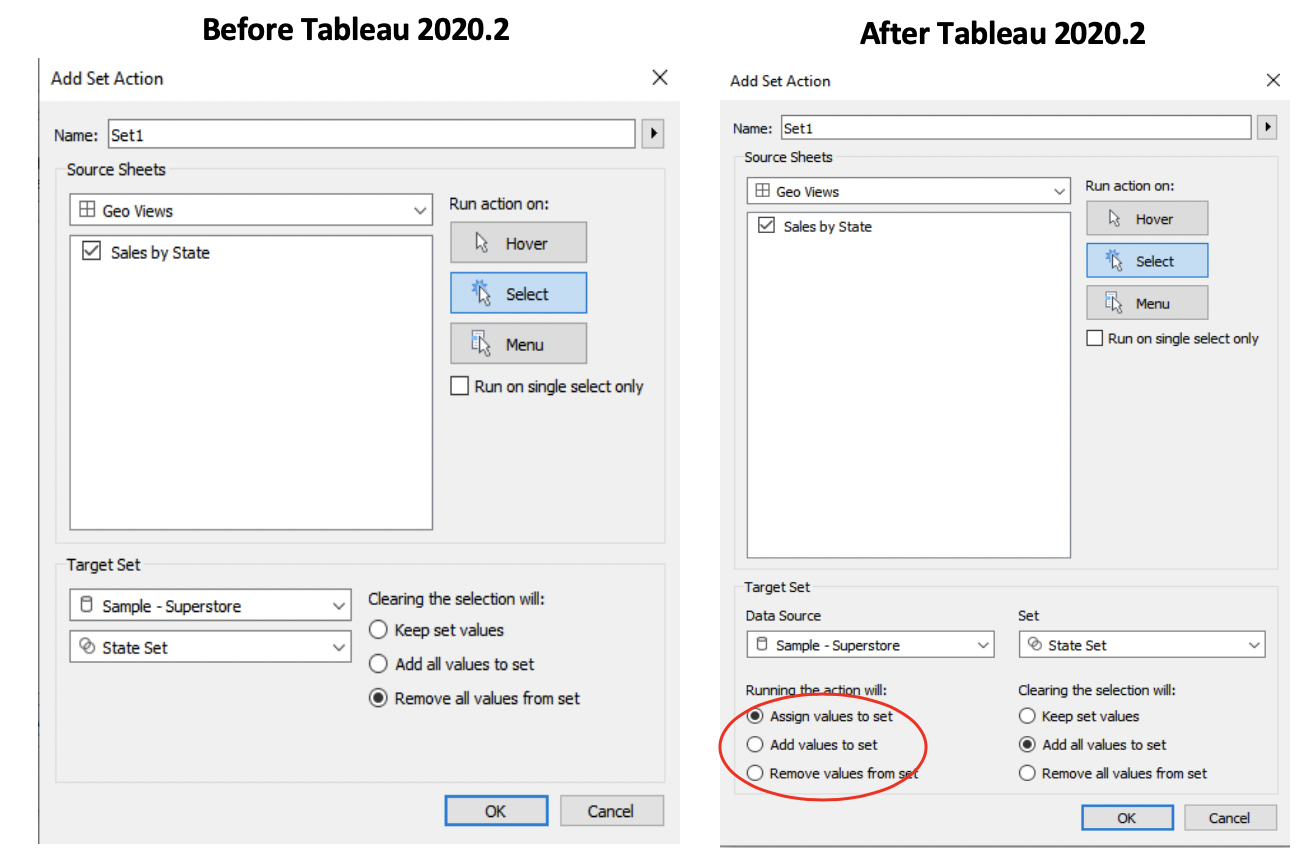
However, with Tableau 2020.2, when we create a set action, we see the menu on the right. We now have these additional options at the bottom. Assign values to set will work in the same way as traditional actions do, but the others will act a bit differently. Add values to set means you can incrementally add values to the set by clicking, while Remove values from set will do the opposite and incrementally remove them.
Set Controls in Action
Let’s see an example of this in action.
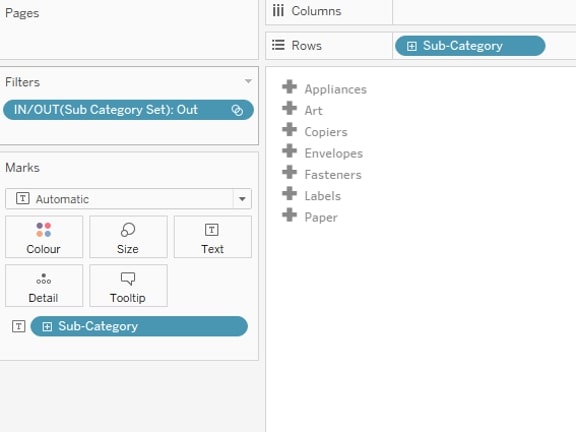
First, create a set on Sub-Category and drag to filters. Add Sub-Category to Rows and Text and untick Show Header. Also, add a minus icon before the text label. Name this worksheet In Set:
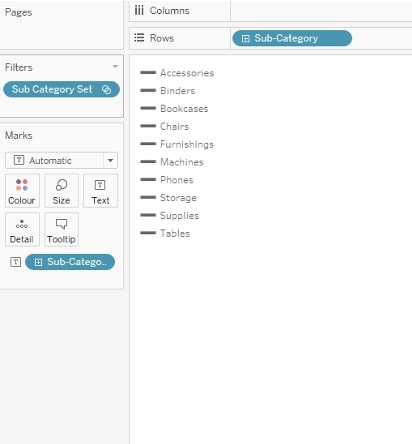
Duplicate this worksheet and name it Out of Set. However, this time, make sure the filter is only showing values outside the set, and change the minus sign to a plus sign icon:
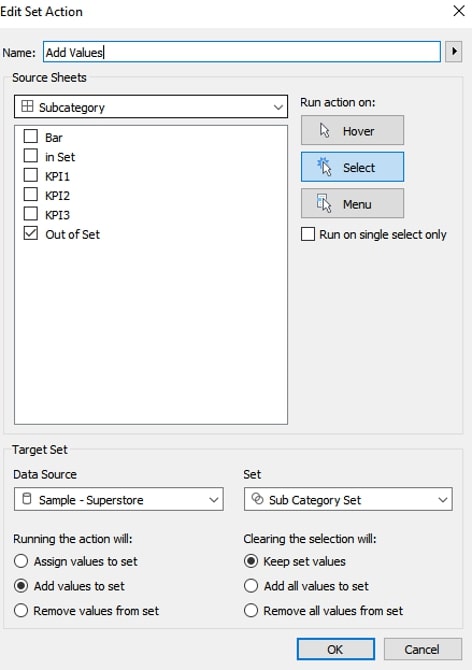
Drag both of these sheets to a dashboard, and select Dashboard > Actions > Add Action > Change Set Values. We need to add two separate actions. On the sheet with the Out of Set values only, we want to give the option to incrementally add values into the set:
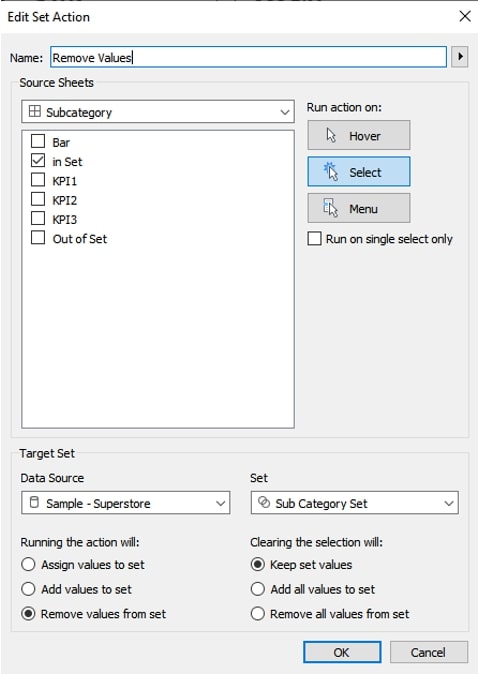
On the sheet with values in the set, we want to add the opposite option. We want the user to be able to incrementally remove these values from the set:
Now, we get two menu sheets where we can add or remove sub-categories to and from the set at will with no need to hold CTRL or worry about selecting the wrong mark and having to start again:
With the additions of some KPIs, a chart and some formatting, we can make a user-friendly dashboard like the one shown at the start of the blog.
I hope this has been useful in demonstrating a small part of the new set controls functionality. If you have any questions or have found some other ways to use this new feature, please reach out and let us know!