This series examines some advanced techniques of Tableau Tooltips and will help you effectively build upon an already solid foundation.
You are probably already aware of sheet swapping within a dashboard in Tableau, whereby a parameter is provided for the user to select the visualisation they want to see … Check out my colleague Keith Dykstra’s blog post that contains some great ideas on improving the user experience of sheet swapping.
We can also use a similar technique to allow users to choose which visualisation to show in a tooltip:

How to Swap Between Viz Views
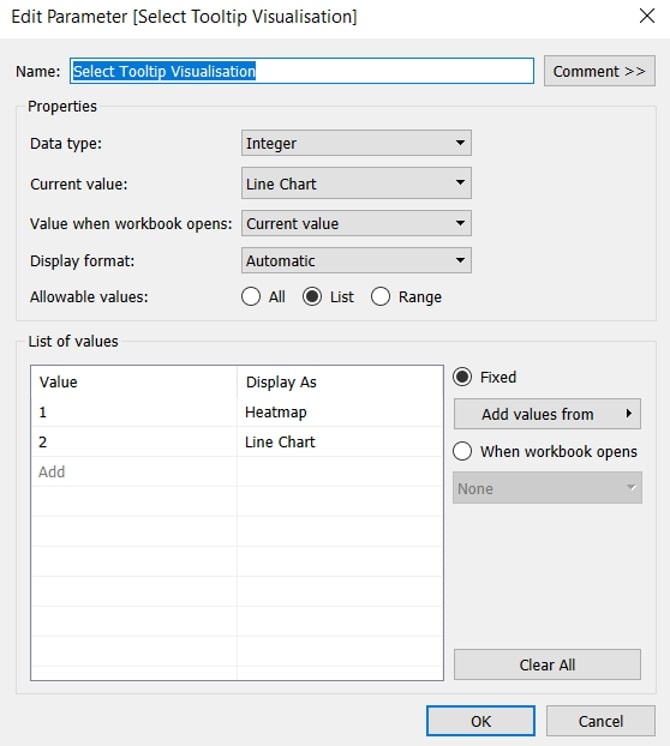
To build this out, first we need to build the main view and the two views we want to toggle between in the tooltip. Once these have been built, we need a parameter to switch between them. Set up the parameter as below:

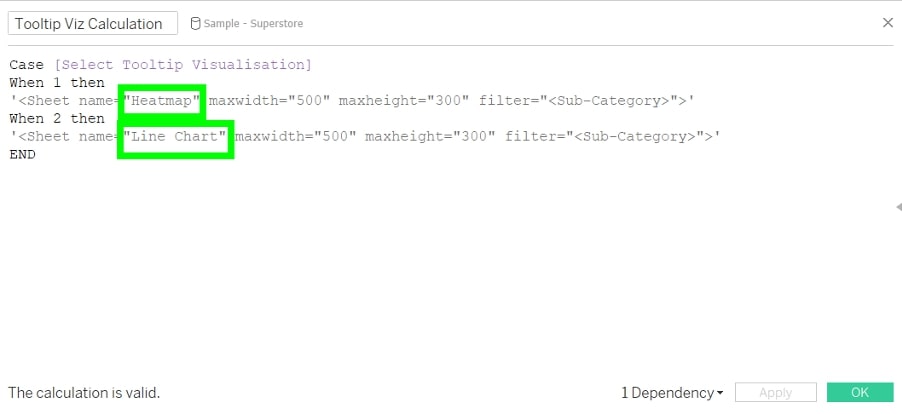
Now we need to create a string calculation to add the correct viz into the tooltip. Use a calculation like the one below (update the strings in the green boxes to the names of your sheets, and adjust the width and height of the viz in tooltip as required):

Applying Filters to Target Sheets
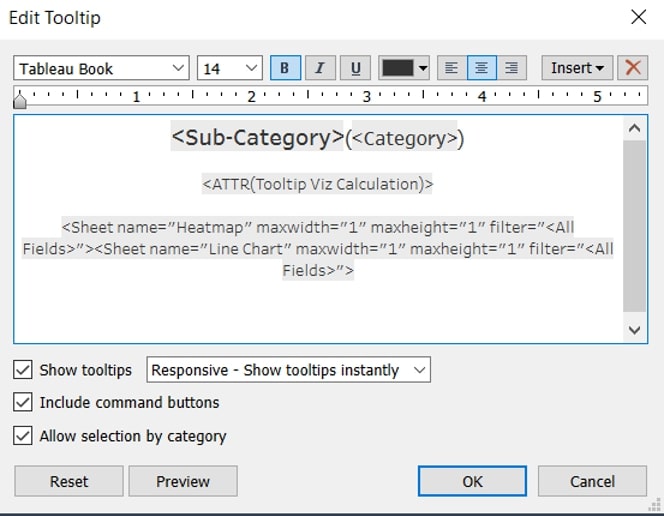
But this calculation alone isn’t enough. If we bring this into our tooltip, the switching mechanism will work, but we will not pass any filters through to the target sheets. To make sure our filters pass through, we need to add both views into the tooltip as well. When we add them in, adjust the height and width to one pixel so that they won’t display. We’ll only see the sheet targeted by the calculated field. The tooltip window will look like this:

Note: Because both sheets have been added as a 1×1 pixel, you will see a message saying “view is too large to show” at the bottom of the tooltip when using this technique.
Add the parameter control to your dashboard, and now your user will be able to select which view they want to see in the tooltip. Nice and easy! Be sure to stop back for the next post in this series on Tableau tooltips.

