Let’s go deeper and see what happens when we break the cardinality, or in other words, use it in a way it’s not designed for. Also, it helps to understand everything a bit better. For those looking for more of an introduction to performance, you should note that this post builds on several other performance-focused posts published prior to this one. You can check out the first of these posts here.
Back to breaking cardinality, there are four combinations available:
- MANY to MANY
- ONE to MANY
- MANY to ONE
- ONE to ONE
Remember: The real cardinality of our data is ONE for the posts, our left table. The Post_IDs are unique. For the comments, our right table, it is MANY as the Post_ID is not unique.
That means the first two options up there will always give us the correct data in our example. Option 2 will be the faster, though. Option 1 is the default option and always ensures that our data is coming in as it should. When the real cardinality is ONE, it doesn’t matter if we set the Performance Options to ONE or MANY. Yes, ONE is faster, but both will give us the correct data points
The other way round does not work. When the real cardinality is MANY (the values of the identifier field are not unique), then we must not set the Performance Options to ONE. If we do, the probability for wrong data points is very high. It is not 100% because it still depends on what fields we drag into the view, but we cannot be sure any more.
There are three stages in this process:
- The joining in the query
- Optional: the aggregation in the query
- The aggregation in the view
A and B are happening before the values get into the view, while C is the usual aggregation of our fields in Tableau.
This is the view that we are working with in our example. It has dimensions from both tables (the Post IDs), and also measures from both tables (SUM of [Likes] from the left table and the COUNT of [Comments] from the right table). I also added the <SIZE() function (computed by cell), which indicates if marks are stacked on top of each other. Nothing to worry about here, but this will come in handy later on.
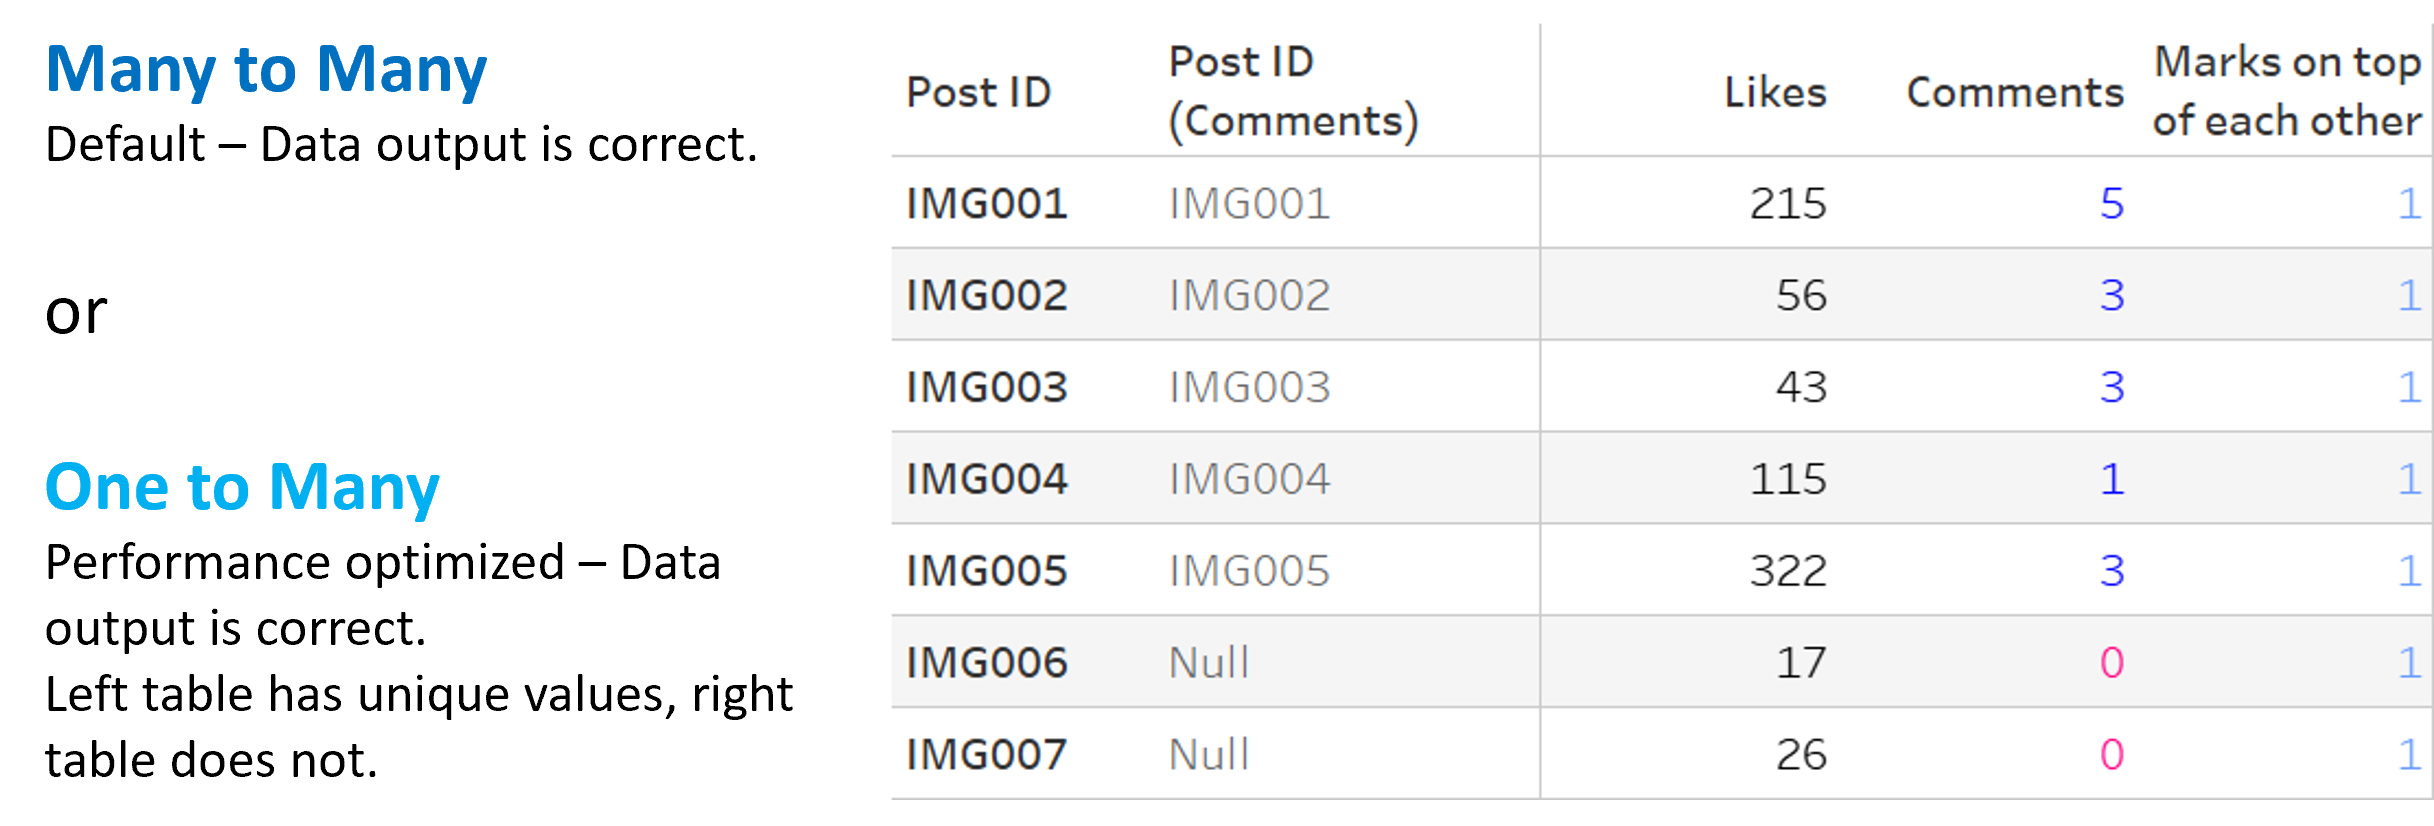
Both combinations (MANY to MANY and ONE to MANY) will give us this correct table. From here on out, we will look at all three numbers. I also will show a few queries that Tableau performs depending on the cardinality – these will relate to the measure [Likes] only, to not make it too complicated.
And I want to start with that: the queries of how it’s working correctly:
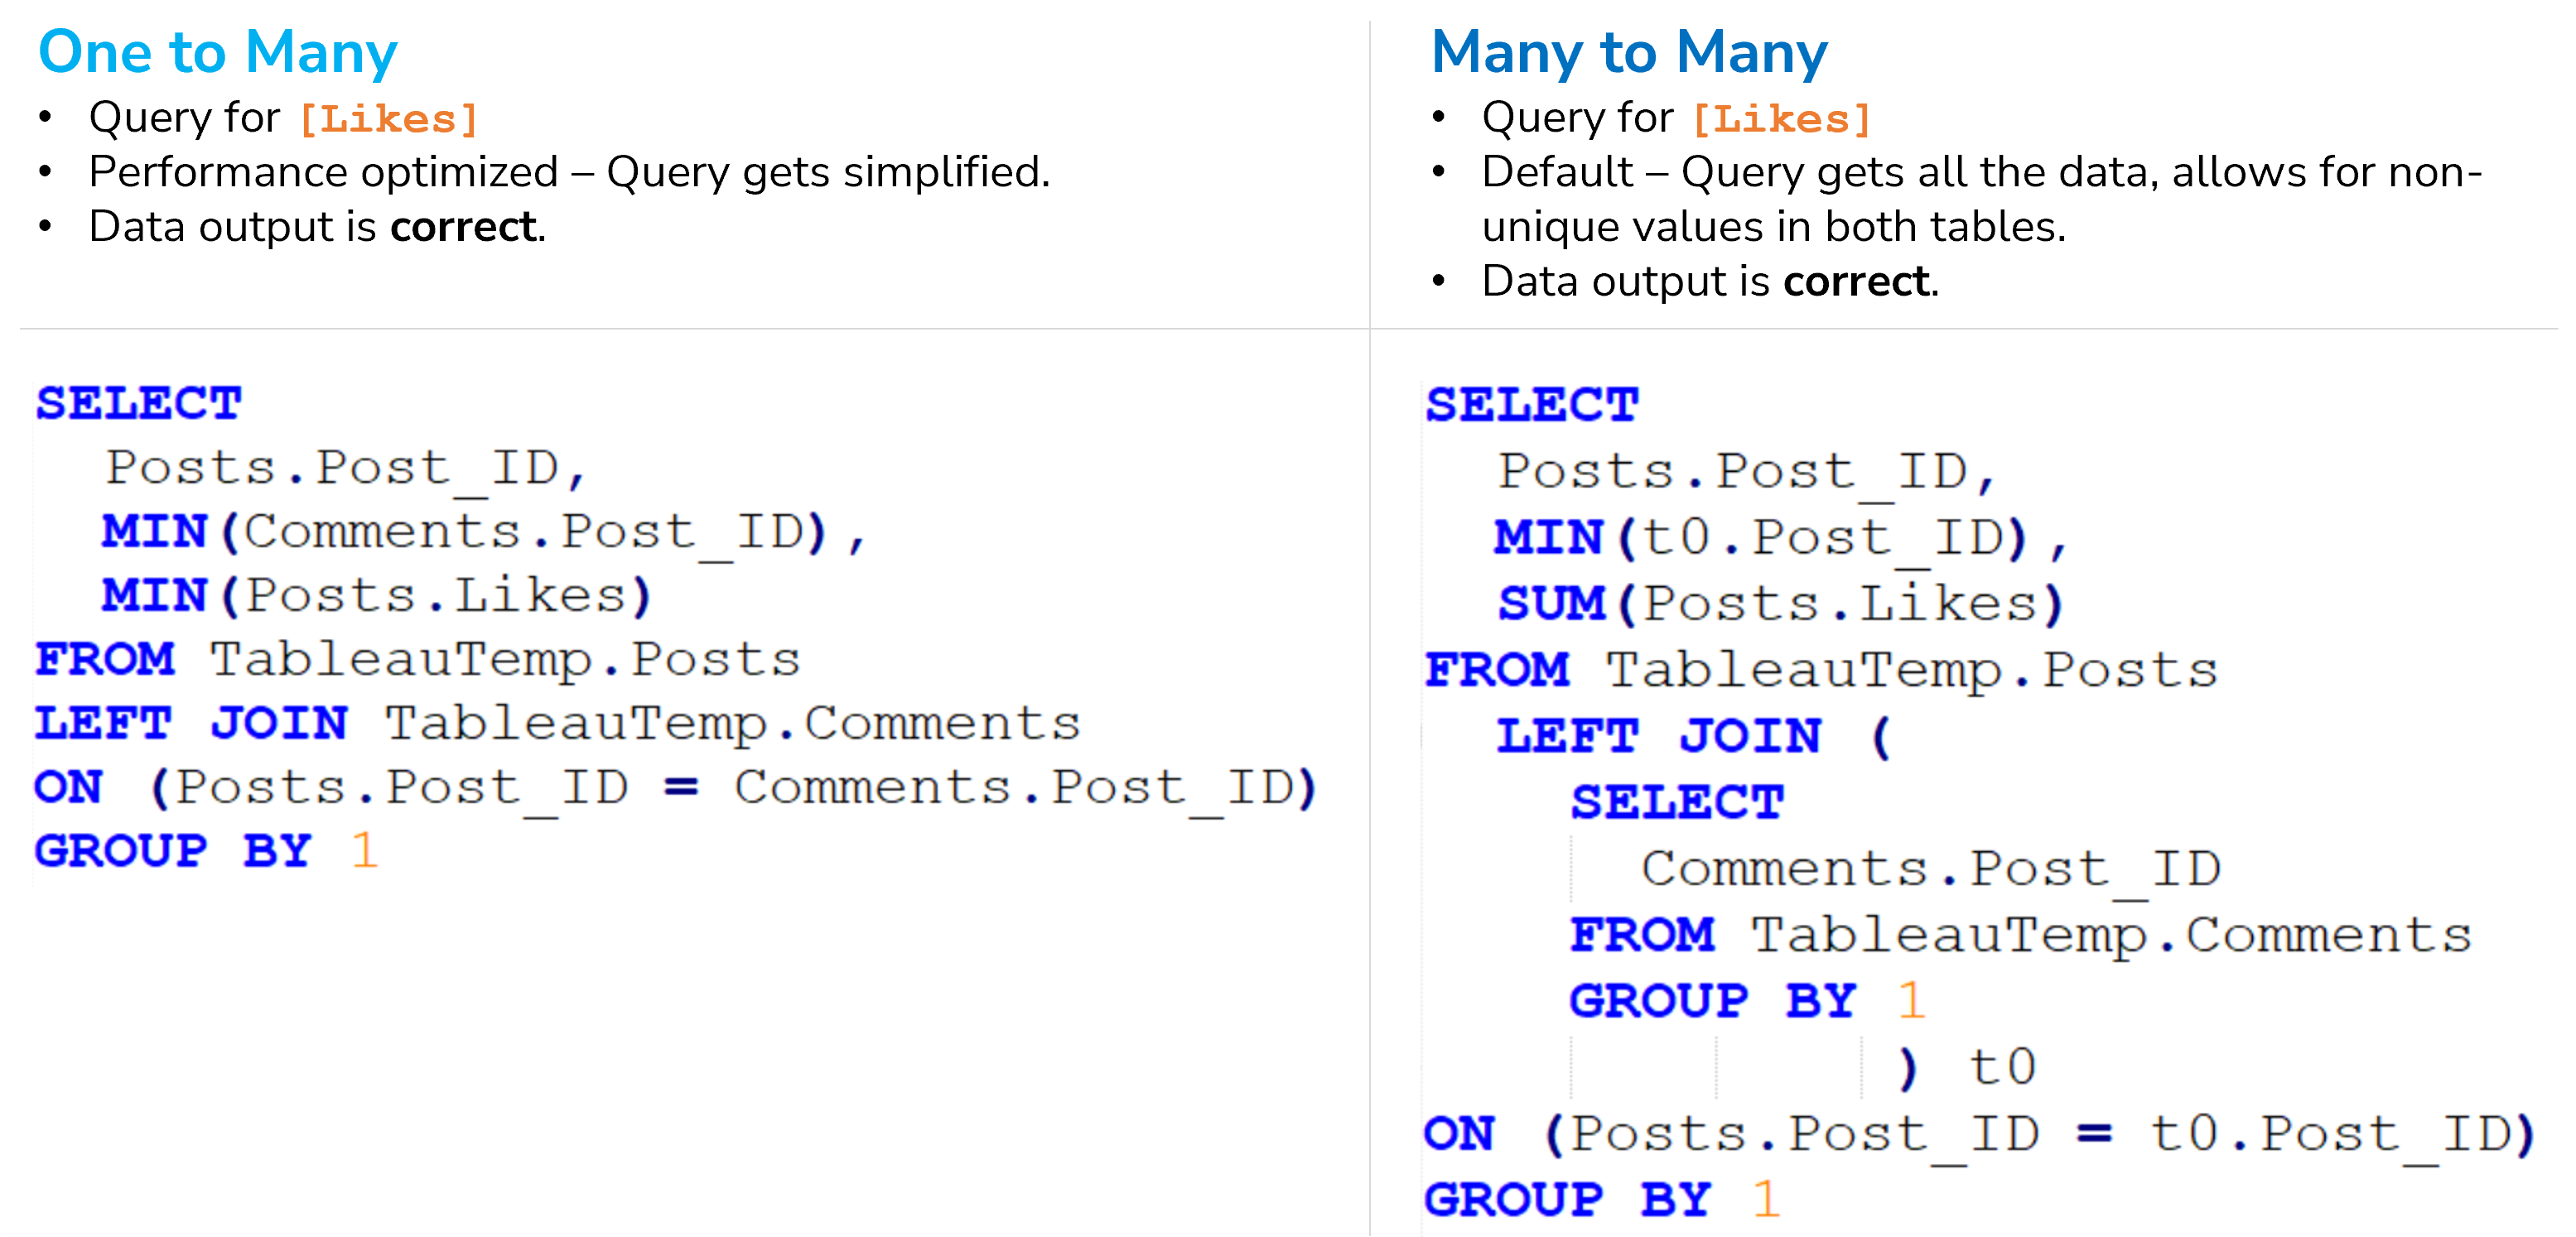
There are a few things worth mentioning. First, the left query is far smaller and simpler while the right one has nested SELECT statements. The left one will only work properly, if the first table (here the posts) has in fact a unique identifier field. Note, that it’s a left join in both cases, but have a special look at the aggregations in there. Both queries are grouped by the Post_ID of the posts table.
One major difference is the aggregation of the measure we are after: the [Likes]. In the left query they are aggregated as a minimum, while they are summed up in the right table. For ONE to MANY cardinalities the minimum makes sense, as there is only one value per row, e.g., the 215 [Likes] for our first post. There is no need to sum this number up, while it definitely would make sense, if the Post_IDs weren’t unique.
Have another look at the left query. Because in the next step, we will switch the cardinalities and create havoc. Now, let’s get our hands dirty!
MANY to ONE in Our Example
Time to switch: I set the posts table to MANY and the comments table in our example to ONE, although I know the values are not unique. Tableau will still join each comment to its respective post in the query, but the result of the query will have only one comment per post.
Tableau first performs a join on the Post_ID, but within that query, it aggregates that Post_ID. With this outcome:
- Left table: The [Likes] of my posts will duplicate (see next images). The post has five comments? Then its <>[Likes] are multiplied by 5. This is similar to a left join, where unique data from the left table may be duplicated, when there are several matches in the right table. These are clearly the wrong numbers, especially when we think back: Avoiding this duplication is one of the biggest perks of Relationships compared to usual joins.
- Right table: The [Comments] of my post will be counted down to only one comment, although there may be several.

This image makes what is happening a bit more visual:
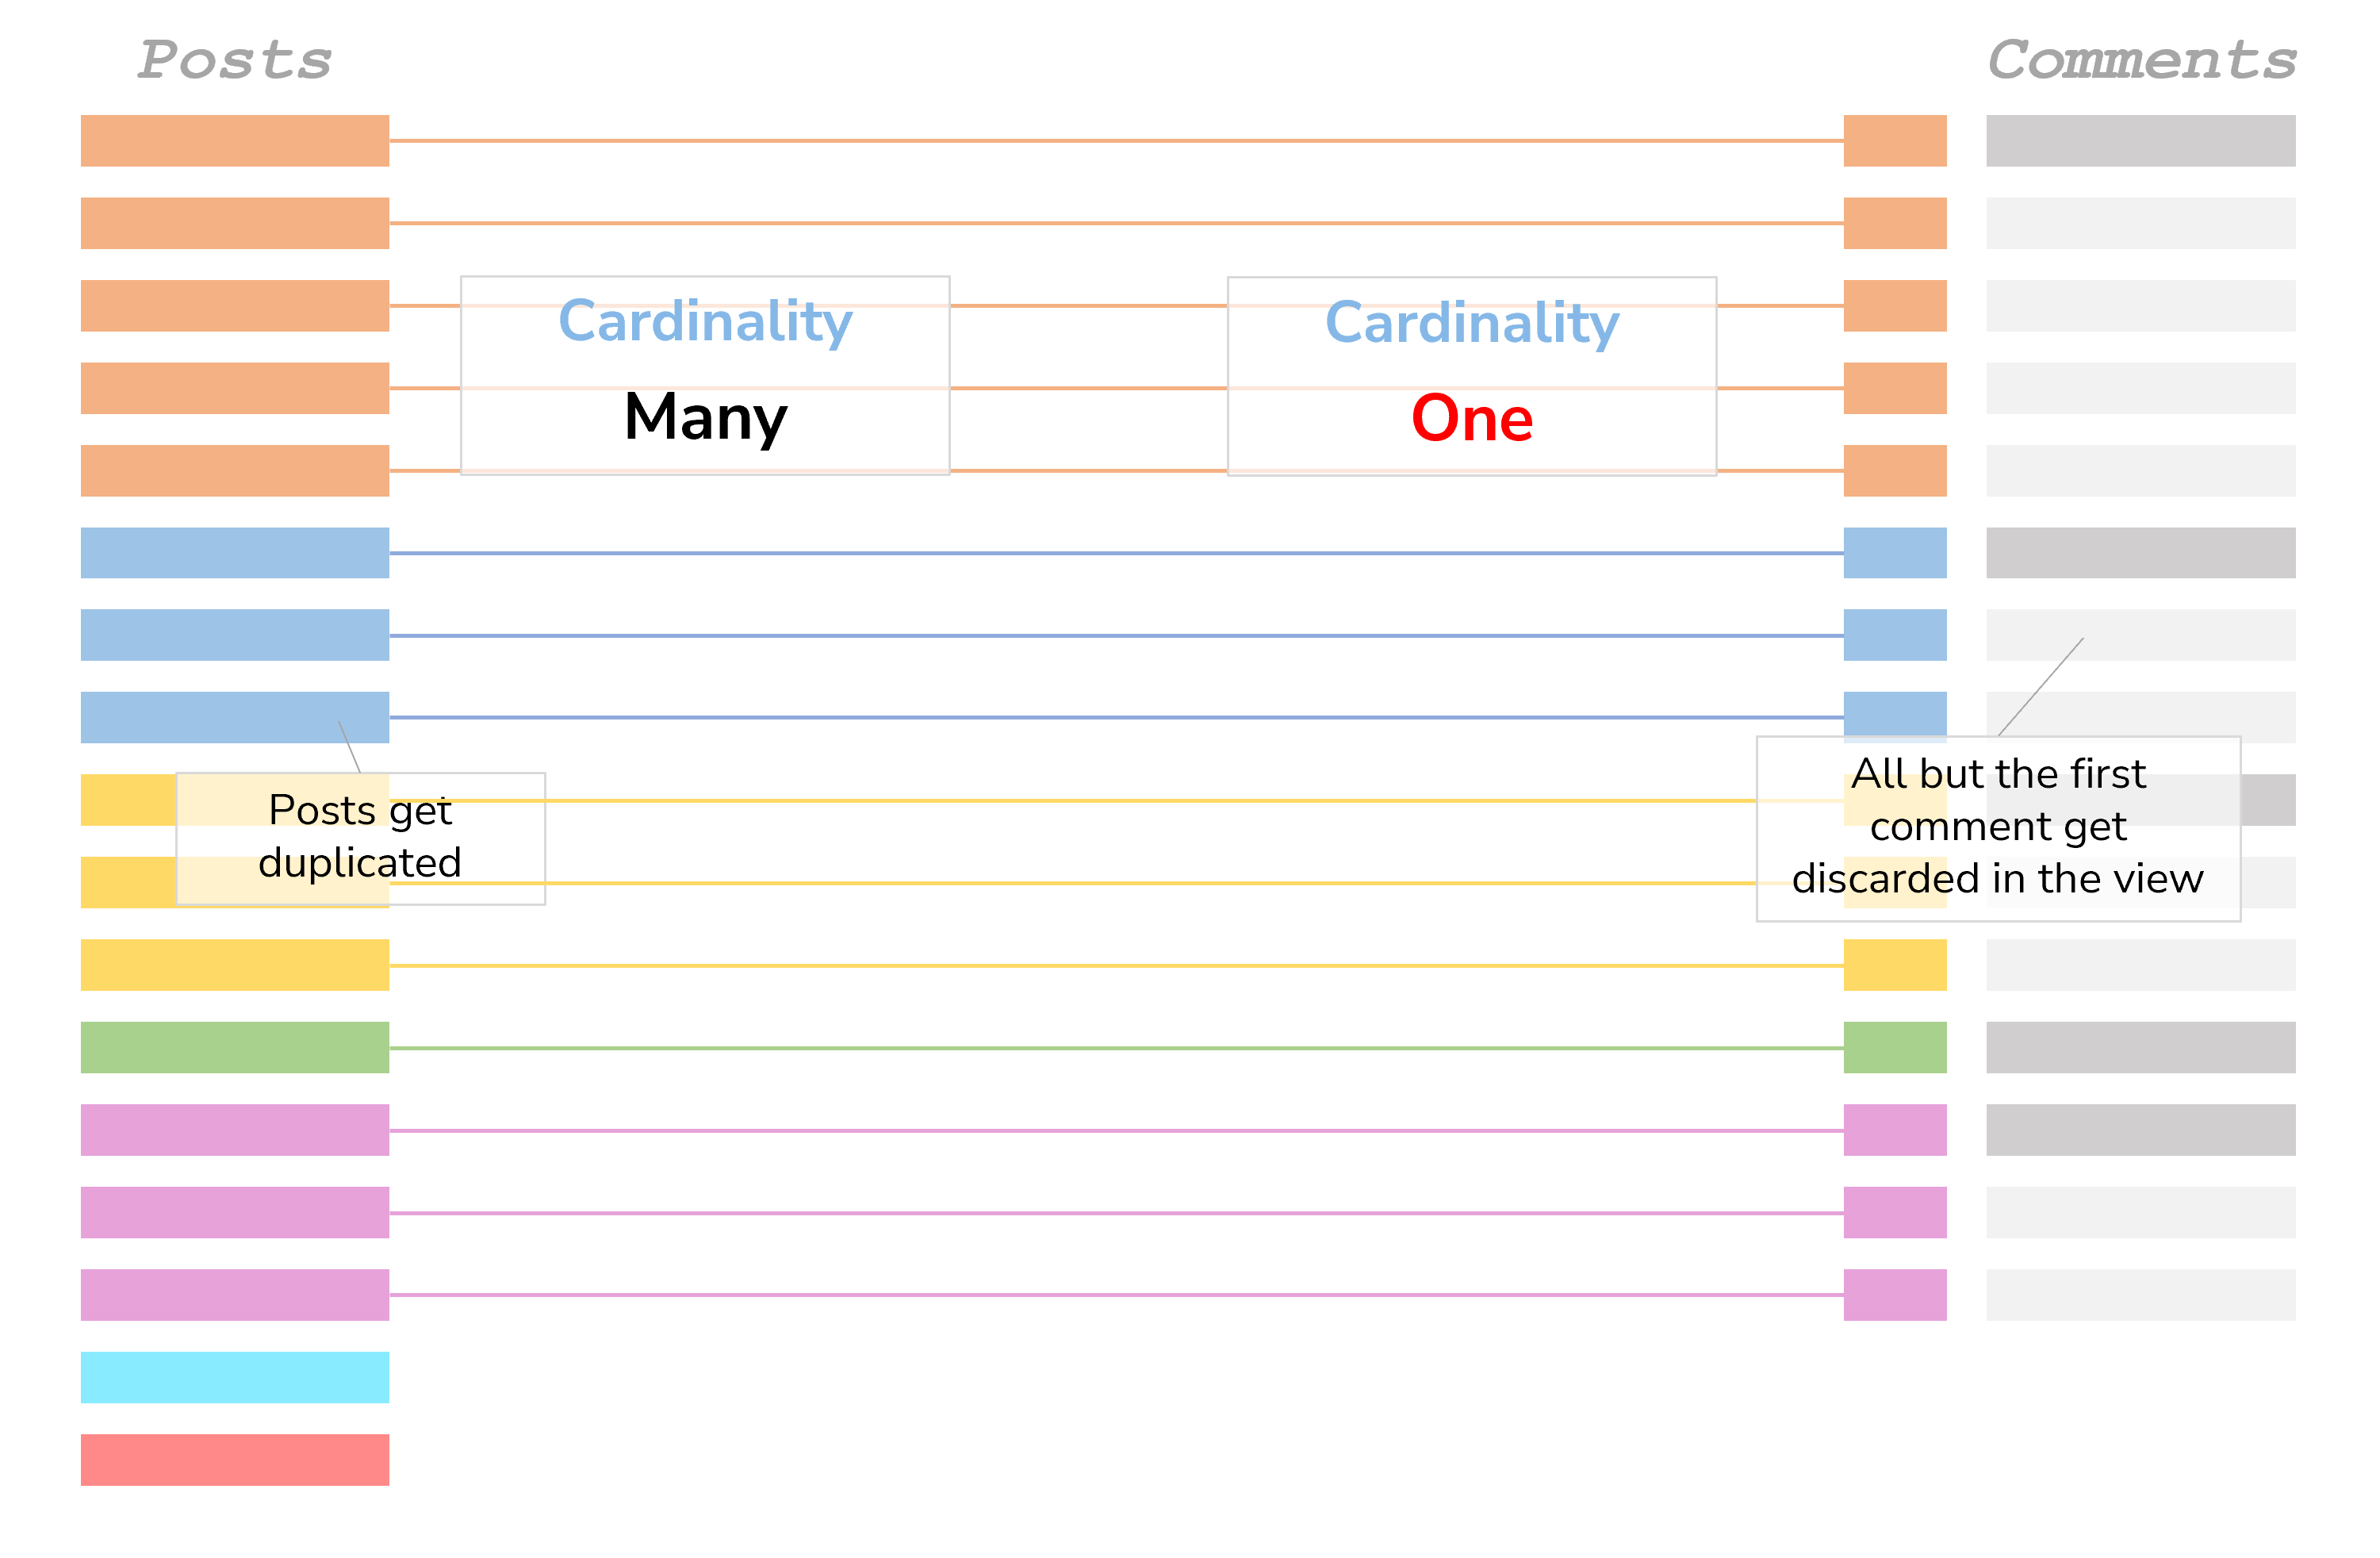
First, the wrong count of [Comments]: If we looked at the query behind it, we would see, that the query is grouped by the Post_ID (Comments). Were the Post_ID (Comments) in fact unique, then this wouldn’t matter; but as they are not unique, Tableau only fetches the first one and with it only the first ID of the comments. The rest are discarded. As such, the count of [Comments] is 1 in the view.
For the wrong sum of [Likes] it looks like this:
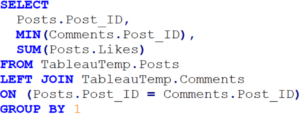
Note that they are summed up in this query. But before that, the join is happening. With it, most Post_IDs get a few more rows via the joined IDs of the Comments. This leads to duplicates that are then summed up – wrongly.
ONE to ONE in Our Example
Let’s go one step further and set both tables to ONE. We are telling Tableau that both tables have the exact same granularity, although they have not. Now, if the data does not support that (like in our example), Tableau will show things in an even weirder way:
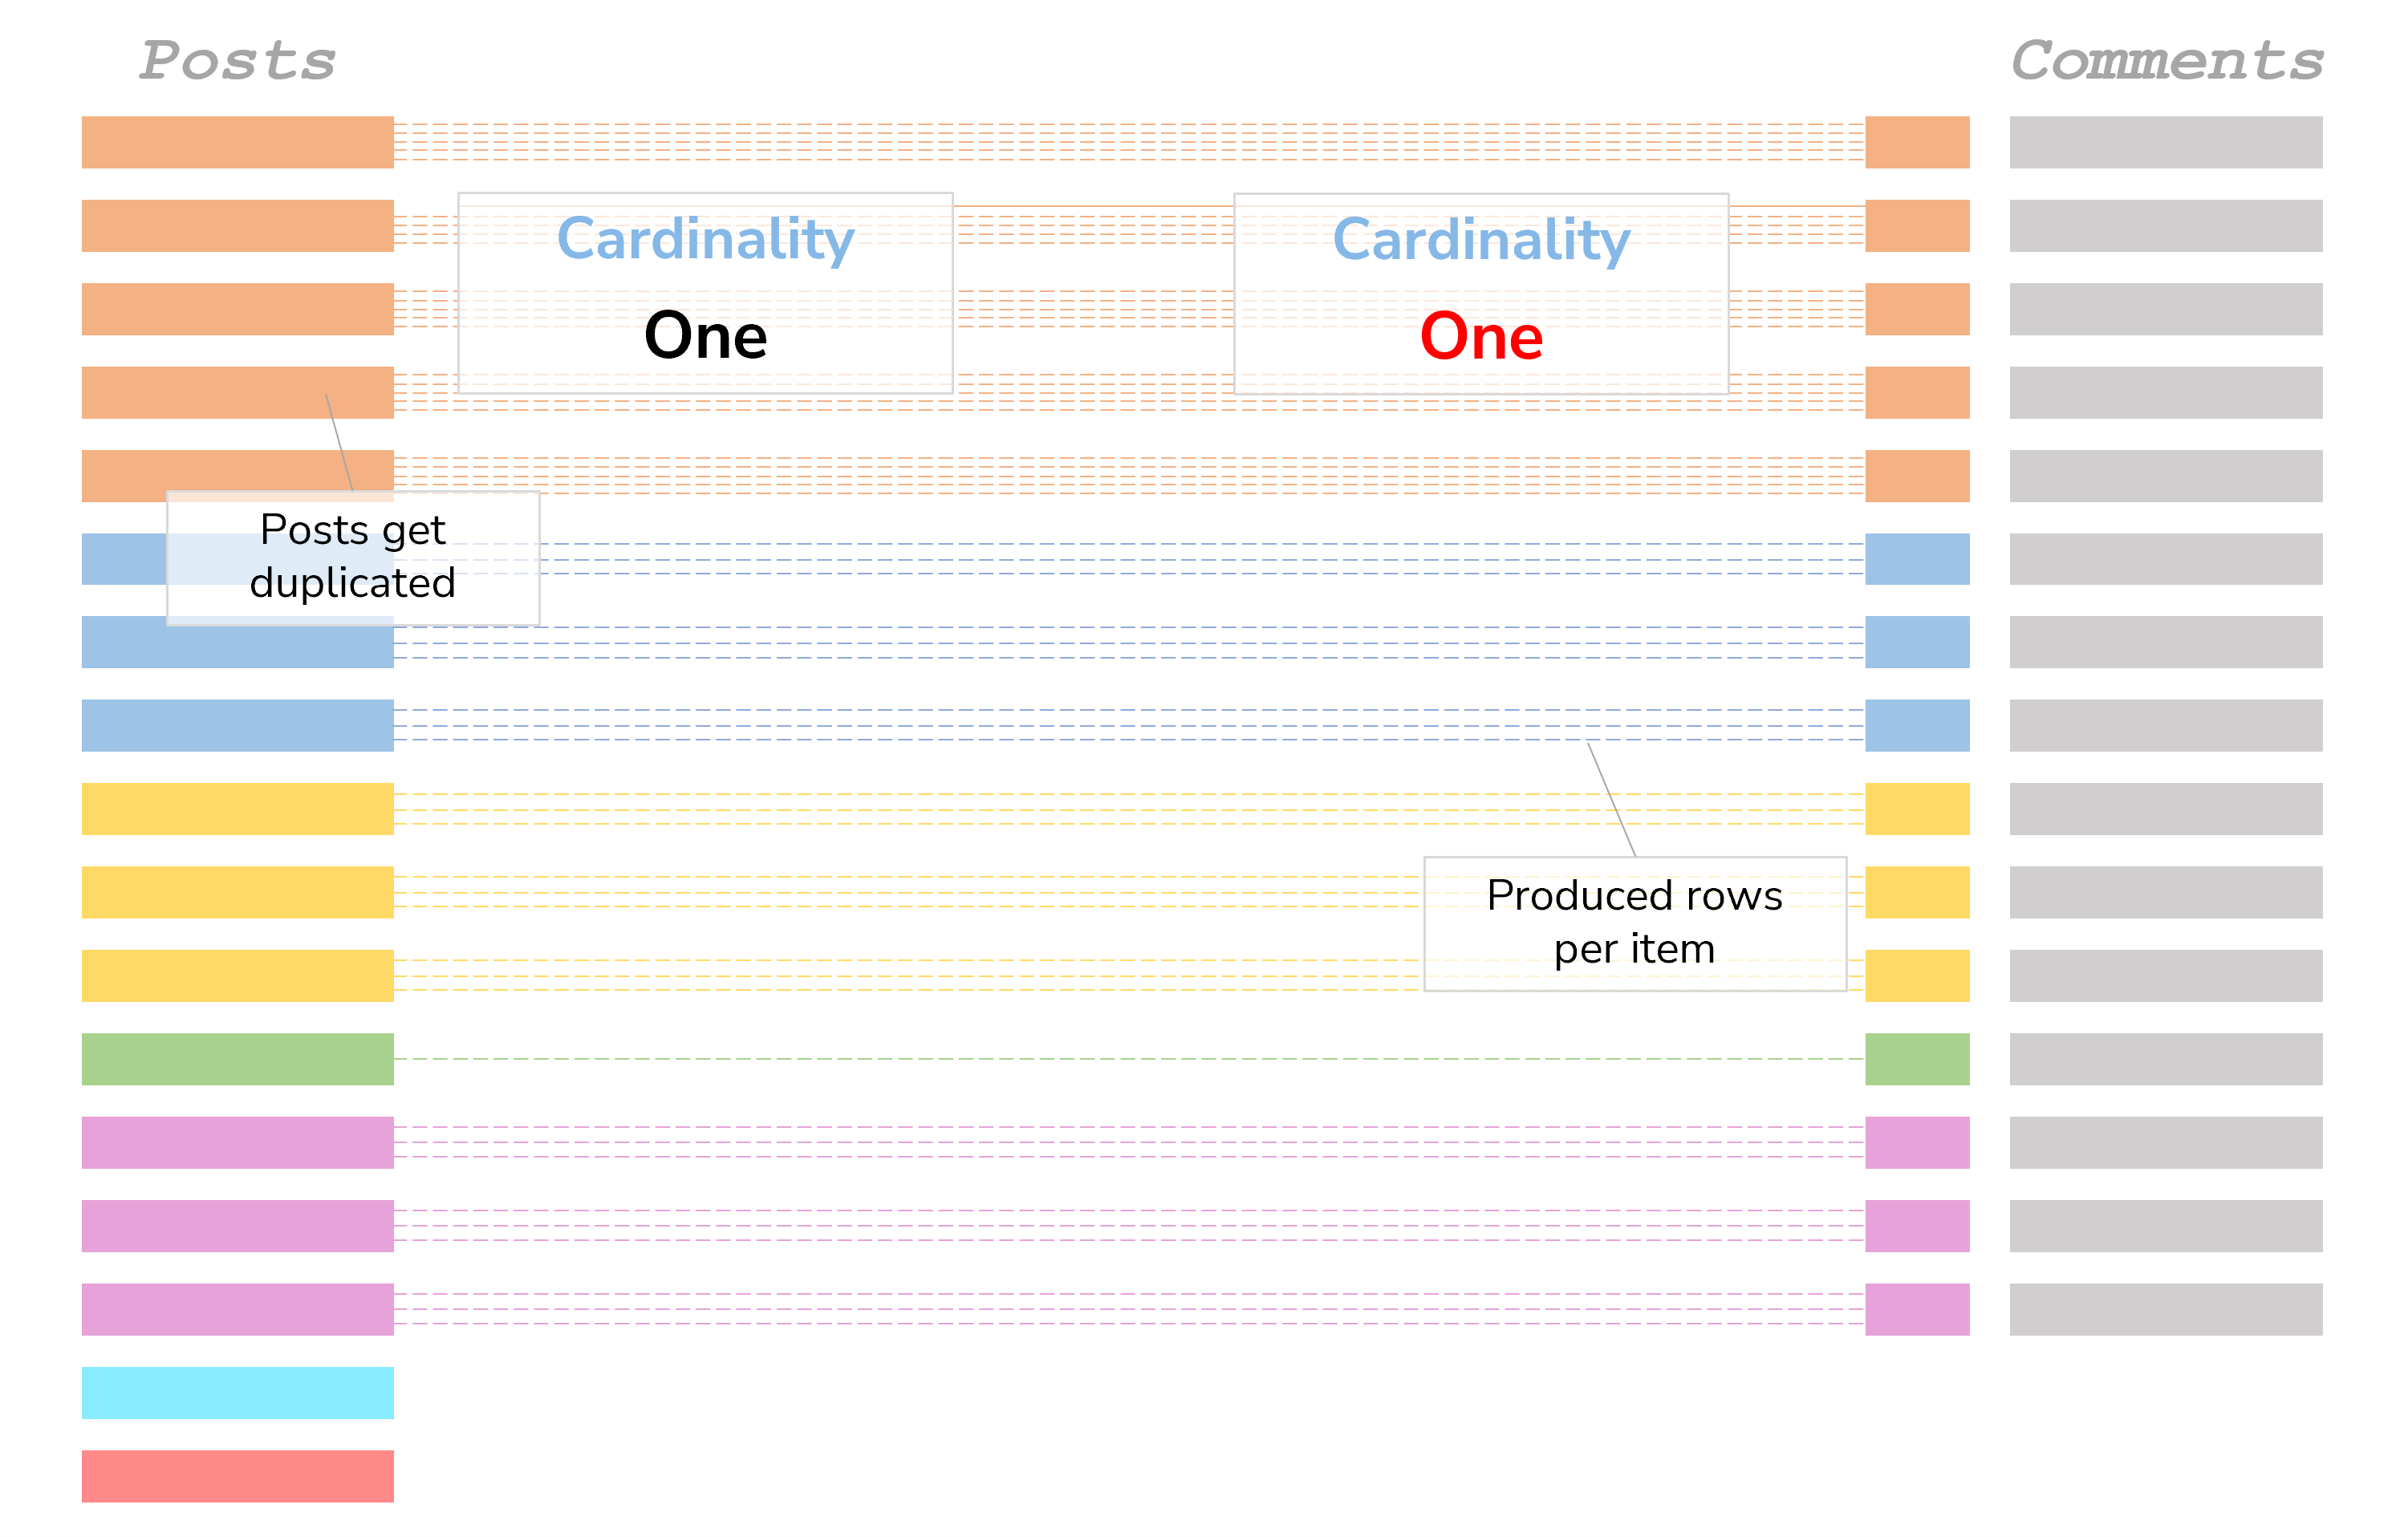
- Left table: We get the correct numbers but duplicated marks. To be specific: The marks are duplicated by the squares of row counts per Post_ID. Sound too complicated? Well, take the lower-right table in the picture: There are 5 comments for our first post (although only 1 is counted – wrongly), so for the first post we’ll get 25 marks. These are all on top of each other, which is why some numbers are bolder than others. It looks like a cartesian join for all rows of every Post_ID.
- Right table: Same as before, but the 1’s are also duplicated on top of each other.

It gets a bit mysterious at this point, that’s why the lines in the next image are dashed:
Once again, in SQL this would look like that:
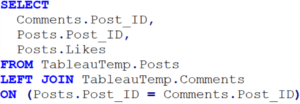
Note that there are no aggregations in here, and the GROUP BY statement does not appear at all.
Seems pretty straightforward. Why the duplication of marks then? Unfortunately, I will have to end this on an unsatisfying note: At this point, neither myself nor my beloved colleagues can say exactly why this is happening, even after chasing all the SQL queries that Tableau performs.
Our current theory: Tableau counts the rows of both tables separately (a 1 for each row, happening in the database query). Tableau then aggregates the row count at some place we cannot figure out (probably within Tableau’s internal VizQL statements). It then puts these two tables together, producing duplicated rows via a Left Join, where the mysterious row count is also duplicated.
Funny enough: If we add the actual comments IDs to our view, everything will sort itself out and we will see a result like with the MANY to ONE combination. But for the view in the screenshot above, it remains a mystery.
Maybe we should just simplify and go with Tableau’s own words: “You will see unpredictable behavior, so don’t do it.”
If you solve that mystery, please reach out to us and earn yourself two hours of Tableau consulting!

