As the first post in a series about Tableau Server on Linux, I wanted to share a quick note and some promising results of performance testing in the upcoming release.
The TL;DR
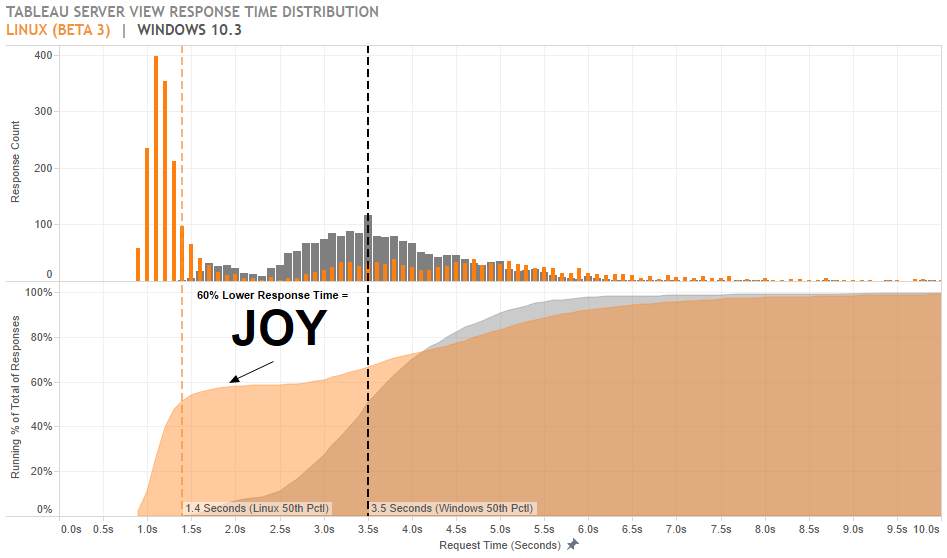
Tableau Server on Linux = Joy. Median dashboard load times were cut 40-60% compared to the same test on Windows. Since hosting costs for equivalent Windows machines can be about twice as high as Linux flavors, you can get this significant performance increase while cutting your hosting cost in half!
The Deets
Note: As with any performance scenario testing, these results are exclusive to this test, and the objective was to hold everything constant except the version of Tableau Server. While I expect the directional result “Linux is faster” to hold true, these exact times will not be reproducible in real life or in your own testing. There will be other variables like concurrency, usage patterns, hardware resources and the dashboards you load. I encourage you to run your own performance test to see the impact for your Tableau environment, or contact me if you’d like assistance. Finally, this test is conducted on a beta version, so things could change by the time this rolls out for general release.
The goal of this test was to conduct a like-for-like comparison between the current production version of Tableau Server 10.3 on Windows and the Tableau Linux Beta using identical hardware resources, files (restored the backup of our internal Tableau Server on Windows to the CentOS Linux server) and process configuration. I used Tabjolt to simulate user traffic and interactions on both servers, and I ran a series of tests alternating between the Windows server and Linux server with Tableau process restarts in between each test.
In some tests, I used zero wait/think time between tests, essentially hitting the servers with a new request after the previous task finished. In others, I used 40 seconds of think time between interactions. In some tests, I used a selection of dashboards that load pretty quickly. In others, I mixed in heavy/slow dashboards. The general result pattern and improvement factor between Linux and Windows was directionally similar in all cases.
What I observed was a much quicker response from the Linux server compared to Windows. In some tests with lighter load, over half of the Linux response times were faster than the fastest response on Windows. This means where a user would normally wait about 2-4 seconds for the viz to load on Windows, the viz could be returned on Linux between 1-1.5 seconds. That makes it feel like browsing a normal website – nevermind the heavy analytical operations Tableau is handling behind the scenes.
To me, and to your end users, this is what joy feels like. This will keep you and your end users in the “flow” instead of being bombarded with an interruption at every request. With a great experience like this, I’d even venture to say it will make your organization smarter. Why? Because they’ll be more inclined to dig into your data and get answers to more questions since the cost of asking is so much lower.
Check out the different distribution patterns of response times for Linux (Orange) vs Windows (Gray) on a typical test:

Not that you should allow your Tableau Server to get overloaded, but one difference I noticed was related to memory usage and error rates. On Windows, when VizQL Server runs out of memory, the process crashes, throwing an error instead of returning the view for a user. On Linux, the memory management seems better – the process does not crash and the views load eventually (sometimes minutes later than they normally would). This manifests as a longer tail of response times in our Linux test results where the server is slammed for an extended period. There are configuration options to help get in front of these issues on both Windows and Linux (vizqlserver.clear_session_on_unload, vizqlserver.session.expiry.minimum, vizqlserver.session.expiry.timeout), but one solution is to also add more memory.
But Wait, There’s More
On Linux, we have more flexibility with architecture, including the ability to add and remove instances of key processes – VizQL Server and Backgrounder – without needing to restart the other Tableau Server processes. This means you can make more effective use of your licensed nodes. For example, you can ramp up backgrounders for off-peak scheduled extract refreshes and subscriptions, then ramp them down to make way for live users again, all without any downtime.
With per-user licensing (instead of per-core licensing), we have even more flexibility to tune your Tableau Server cluster to meet the demands of your business users and IT at the same time. With more ways to make Tableau Server cater to your organization’s unique needs, the launch of Tableau Server for Linux is a great time to evaluate your deployment and see if an adjustment is in order. If you’d like strategic or tactical assistance with this process, give us a shout.
Bio-Dome
Because both servers and configurations were identical, the environment is more or less irrelevant. I know you’ll ask anyway (I know I would be curious if I were you), so here it is.
The differences:
- Windows Server 2008 R2 running Tableau Server 10.3.1
- CentOS Linux 7.3.1611 running Tableau Server for Linux Beta 3
The similarities:
- 8 cores (2.67ghz Xeons)
- 32GB RAM
- Same datacenter, identical hosts
- Content (took a Tableau Server backup on our Windows instance and restored it to our Linux instance)
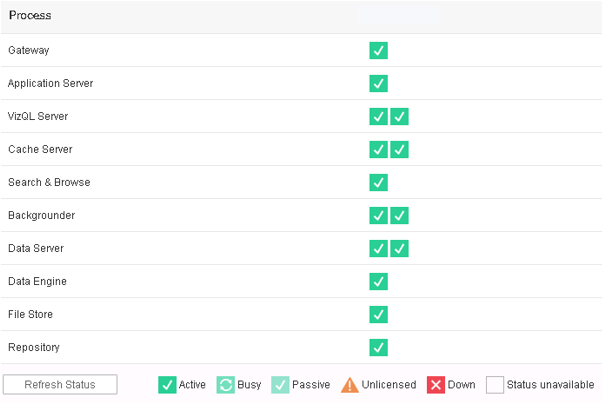
- Process configuration:

More Coming Soon!
Stay tuned for more in this blog series as we explore the changes to Tableau Server for Linux and TSM and uncover the value for your organization. If you’re interested in beta testing and providing pre-release feedback to Tableau, you can enroll in the Tableau Server for Linux Beta.

