Wiederholung des Webinars – 5 tolle Tableau Funktionen, von denen Dir noch niemand erzählt hat

Hier bei InterWorks knacken wir gerne Rätsel und beantworten die Fragen, die unseren Kunden das Leben leichter machen. Jetzt möchten wir einige dieser Geheimnisse gerne mit Dir teilen. Melde Dich einfach zu unserem Webinar an und erfahre mehr über ein paar der großartigen Funktionen, die Tableau zum führenden BI-Tool machen. Zum Beispiel: Rechtsklick und Ziehen… […]
Advance with Assist: Tableau Server Migrations
Question: I need to migrate Tableau Server; what are my options? Should I be using something like Azure Site Recovery or AWS AMIs to move my cluster? The Challenges There are a few challenges to using any sort of snapshot-based technology to migrate a Tableau Server deployment, especially a multi-node deployment. This goes for Azure […]
Celebrating One Year of Virtual Water Cooler Chats

It was just about this time last year when things started to turn on their head. The COVID-19 global pandemic hit, and drastic changes followed. While I was already a remote employee, working from home was not new to me. However, I had a client trip to New Jersey taken off the books, and I […]
Exploring the New Map Layers Feature in Tableau 2020.4
It took a few years, but Tableau finally made a wish come true that had been long held by a large part of the Tableau community: the ability to visualize more than one layer in a map. With Tableau Desktop version 2020.4, we can do this using a new feature called Map Layers. What’s This […]
PREVIOUS_VALUE in Tableau verstehen
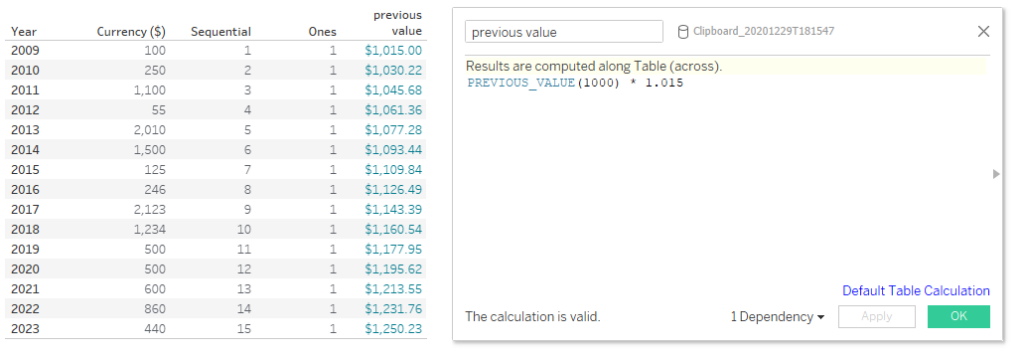
Was um alles in der Welt macht die Funktion? Wisst Ihr was? Ich arbeite mit (und lehre) Tableau seit über 5 Jahren, und ratet mal, wann ich diese Funktion endlich verstanden habe… Das war gestern. Und lasst uns eine Sache direkt aus der Welt schaffen: Wenn Ihr die vorigen Werte anzeigen wollt, ignoriert PREVIOUS_VALUE, denn […]
Webinar Wiedergabe – Designs für mobile Geräte

Tableau bietet die Möglichkeit, so viel oder so wenig Einblick zu gewähren, wie der/dieErsteller*ines für richtig hält.Manchmal kann auch wenigerInformation mehrBotschaft vermitteln. In diesem Webinar werden wir Dirzeigen, wie Du ein Dashboardsoerstellst, damit Du es mit Nutzernteilen kannst, dieunterwegssind. Wir werden Dirdabei helfen herauszufinden, was einDashboardmit begrenzterMenge an Platz für die Kommunikation benötigt. Folgendes wirst […]
Virtual Event Recap: Tableau Deep Dive: Changing Your Crosstab Culture

Our most recent virtual Lunch & Learn covered how to change your crosstab culture. Crosstabs are one of those enduring and painful components of analytics where you make something beautiful, and someone somewhere asks for a table of numbers. The problem is that tables of numbers aren’t great – or even good – at communicating […]
Bringing Custom Color to Your Tableau Dashboards
A friendly reminder: Tableau purchased Power Tools in 2019. Contact us for more information. Ready to add some more flavor and personality to your dashboard but not sure where to start? Color can be a difficult component to tackle when building out a dashboard, but luckily there are a lot of great resources that can […]
Using Excel PERCENTILE Functions in Tableau
If you are transferring a dashboard from Excel to Tableau, and the Excel file uses the PERCENTILE.INC and/or the PERCENTILE.EXC functions, this is how to handle them in Tableau. Some Basics of Percentile Calculations There are several different methods of calculating a percentile score, but there are a couple of basic concepts that apply – […]
PYD108 – Carlos Rodriguez, Johns Hopkins University

Today’s Podcast Your Data episode features a PYDChats conversation with InterWorks East Coast Regional Lead, Nayeem Ahmed, InterWorks Northeast Regional Lead, Ben Young, and Carlos Rodriguez, the Director of Business Intelligence and Development of Alumni Relations at Johns Hopkins University. These three speak about the importance of data literacy in the higher education space, as […]