
In this recent webinar, we talk Tableau releases, past, present and future. This blog is a thorough recap of that webinar, but if you’re looking to just catch the replay, skip down to the bottom of the post!
To frame the discussion, here’s a quote we found from Aaron Koblin: “I think you can have a ridiculously enormous and complex dataset, but if you have the right tools and methodology, then it’s not a problem.” This is a focus that a lot of us have in the analytics space when working with data. With the vast increase in the size and complexity of data, we see Tableau rising to the challenge and transforming that data into useful insights.
Reviewing Tableau 2020.4
Here’s a quick summary of the highlights from this version:
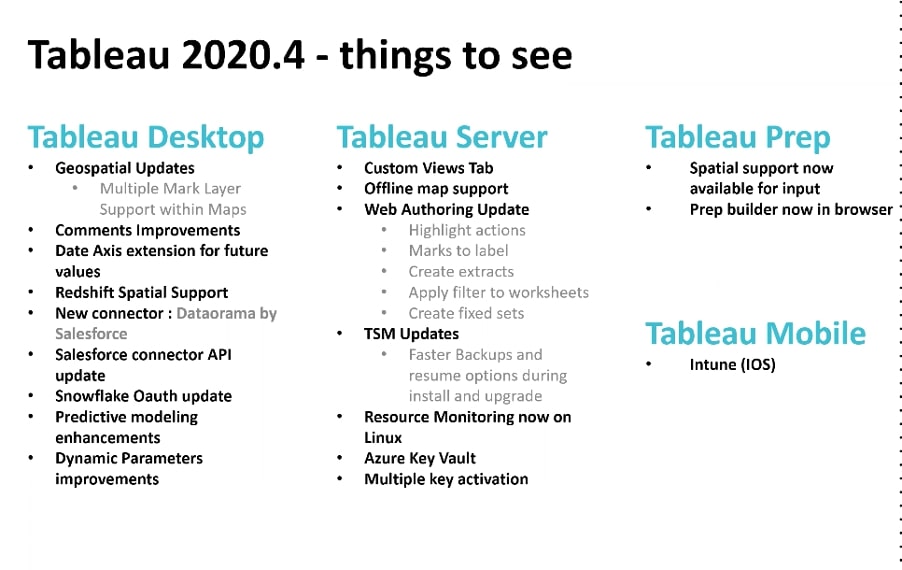
We won’t cover all of them, but below are some of our favourite features from this version.
Tableau 2020.4 – Map Layers
This was one of the most anticipated updates that caused a lot of excitement for Tableau users. With the map layer enhancement, we saw enhanced geospatial analysis, additional map for greater context in your map visualisations, offline map support and no more dial. We also saw additional spatial support become available in Prep.
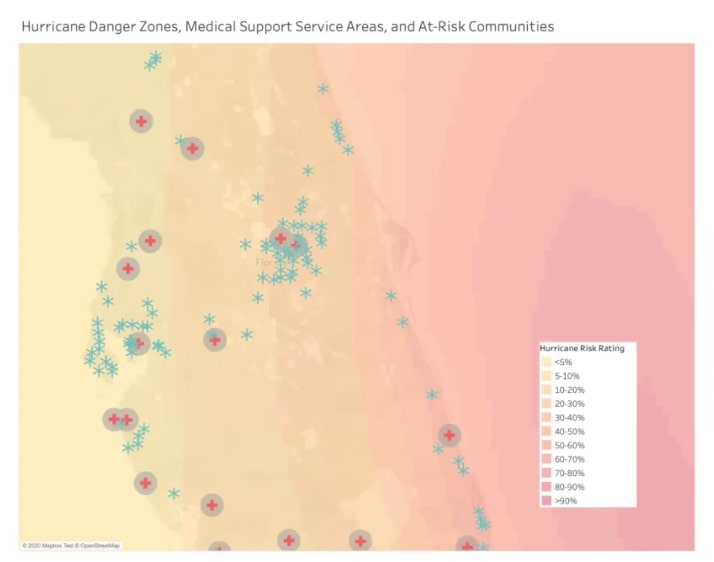
So how did they build this? How did they get the colour? How did they get two marks into the dashboard? Thanks to map layers, this is now a simple trick. Anything that has the spatial geocode globes in your field panes you can now drag to the board, creating charts like the above easily. Here, we see one mark for the colour, one mark for the medical support centres and finally, a mark for the at-risk communities.
Map layers are now super intuitive and take mapping to a whole new level. A word of caution, though: you can have too much of a good thing. Try not to overload your maps with multiple map layers.
Tableau 2020.4 – Prep in Browser
If you have never used it before, Tableau Prep is the tool you would use to shape your data before it enters the visualisation stage in Tableau. Now, you can access Prep from the browser within your Tableau “Connect to your Data” page. You can go ahead and do all of your data work in the Prep browser with no loss of functionality and save it back to the server.
Tableau 2020.4 – Block Comments in Calculations
If you wanted to comment a specific line out for Tableau to ignore, you could do two // on the line, and it would be ignored by Tableau when the calculation ran. The errors occurred when you had a complex calculation, and when trying to figure out which piece of the calculation was your problem, it starts to get overly complex. Now with block commenting, you can use the markers /* and */ that make it simpler to debug.
Tableau 2020.4 – Predictions and Date Axis Extend
There are now two additional models located in the table calculations functions: MODEL_PERCENTILE and MODEL_QUANTILE. These are ways of doing predictive modeling, linear regression and progression. Whenever you are modeling, one of the things we want to do is move into the future and run some predictive analysis with our model in forecasts. This is all now possible by way of axis extensions. Now, you can go into Tableau and extend your model for however long you want from the pre-set list or custom:
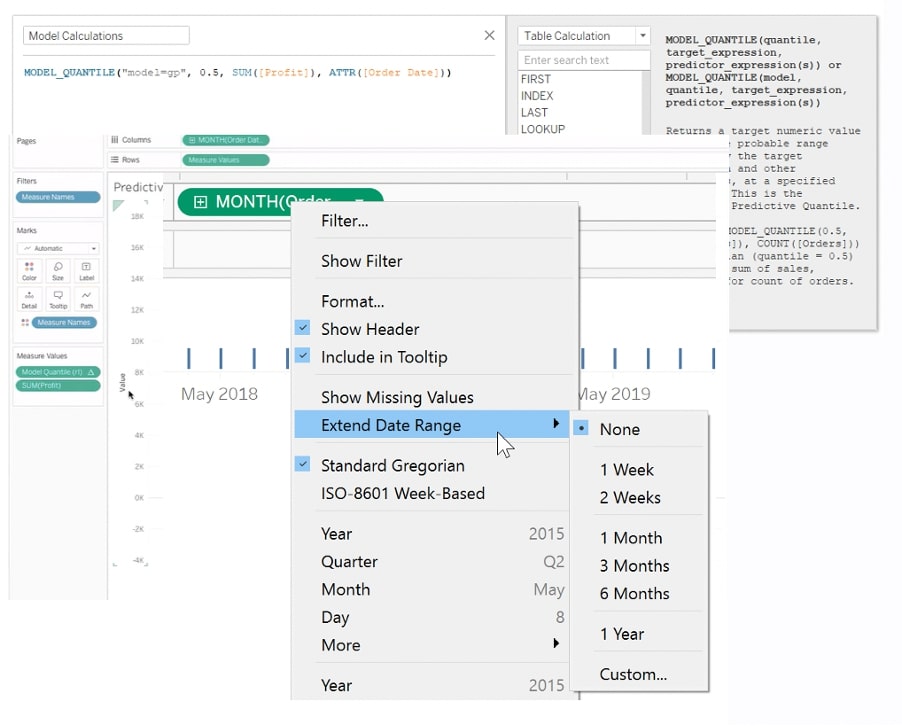
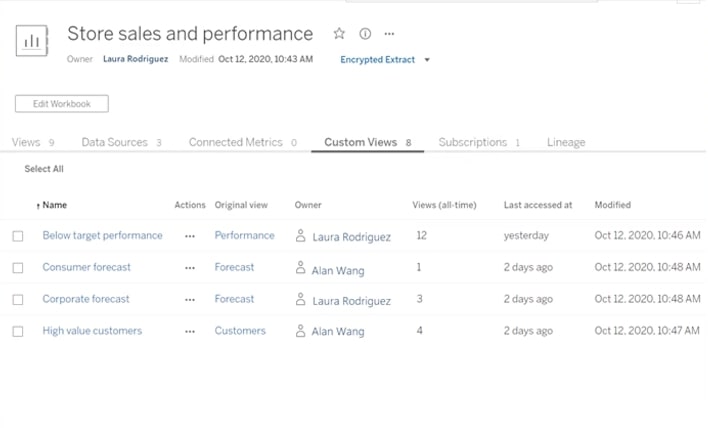
Tableau 2020.4 – Tableau Server Custom Views
On the Tableau Server side, we have the nice new feature of custom views. It’s a great new feature that allows you to set your filters, so the next time you come to a view, it has saved your changes whilst allowing other users to do the same. You can subscribe to those custom views and receive them via email to save you logging into Tableau Server. For Tableau Server admins, it just got a whole lot easier to identify what each user is receiving with the Custom Views tab:
Our Favorite New Features from Tableau 2021.1
Now, let’s have a look at Tableau 2021.1 and walk through some of our top updates from the latest version:
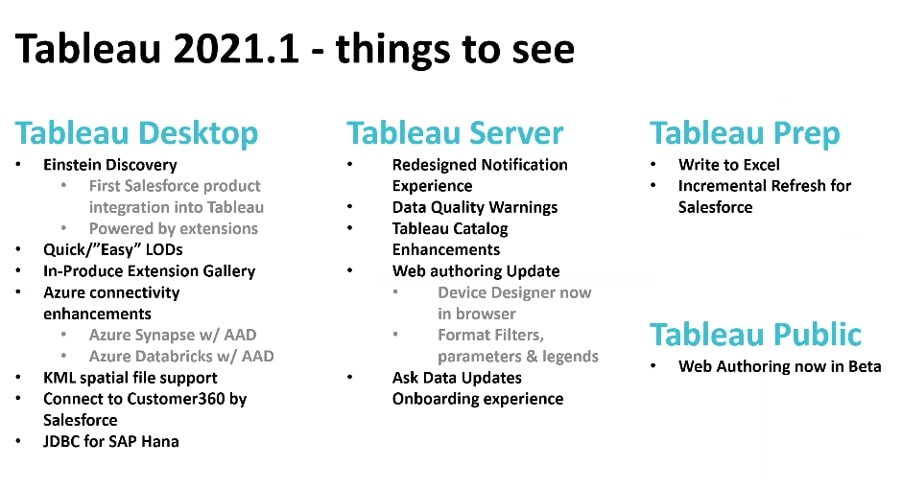
Tableau 2021.1 – Einstein Discovery
If you have worked with Tableau for a while, after the acquisition by Salesforce, we all started wondering when the two dev teams would start working together. Well, now is the time. We won’t go super in-depth with this feature, but we hope you’ll take away its basic definition and what it brings to Tableau. Be on the lookout for a more detailed blog post about this and other new features!
Einstein is a Salesforce product that builds models based on your CRM data that’s contained within Salesforce. It will answer questions on a predictive basis using your existing data, which is incredibly powerful. You can then surface these models in Tableau to create your visual analytics.
Let’s look at the steps:
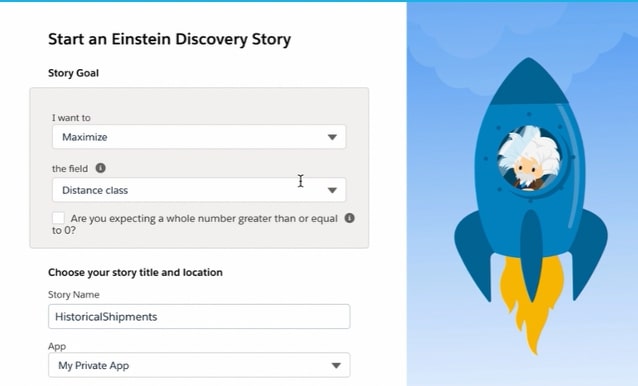
The high-level overview is that you’ll build an Einstein Discovery Story for use in Tableau. This story can be a connection to a Salesforce object or to a file, like a CSV, for example:
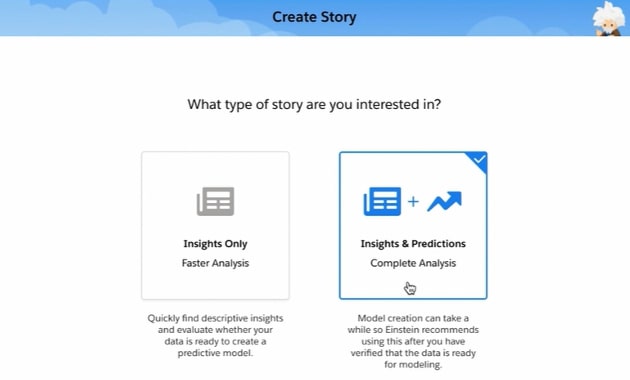
Next, you’ll complete the setup for the Story. Insights only? Insights and Predictions? There are automated options within this setup, and manual options you can tweak after you know how it all works:
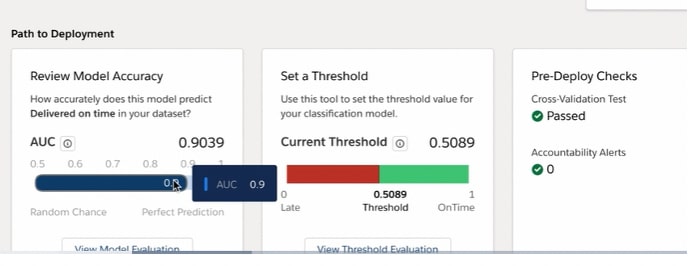
With the modeling setup complete, Discovery will analyze the dataset. You can then check the accuracy scores before clicking Deploy Model:
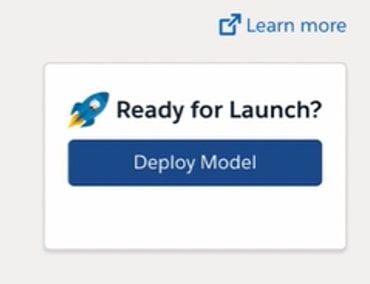
Deploy if you are happy with your Story and setup, and after that, Tableau can then use these insights. Now let’s hop over to the Tableau side.
You’ll need a sheet to be set up in Tableau that contains in detail all of the fields you used on the Einstein side to build the models around. Jumping to a new dashboard there is the new extension object you can pull in from the extension library (also reworked in Tableau 2021.1). Next, we’ll map the model fields to the data fields and then tackle labeling and formatting. which your end user will see:
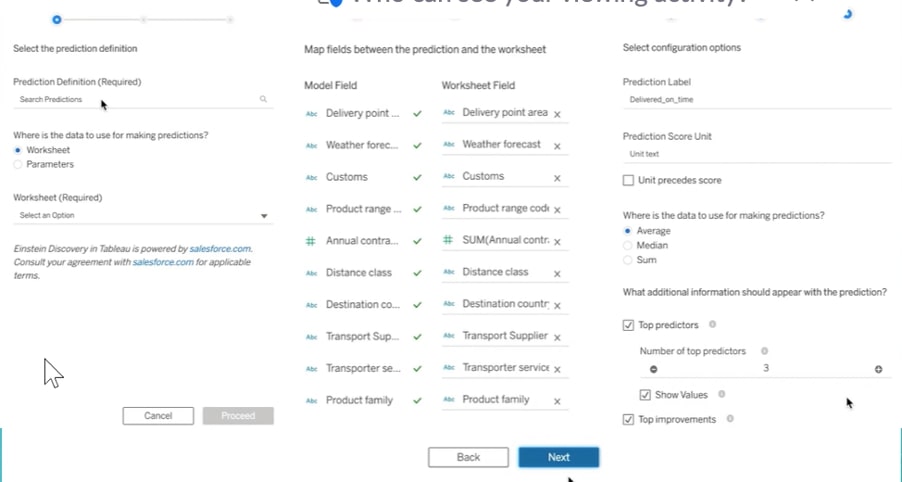
Once the setup is complete:
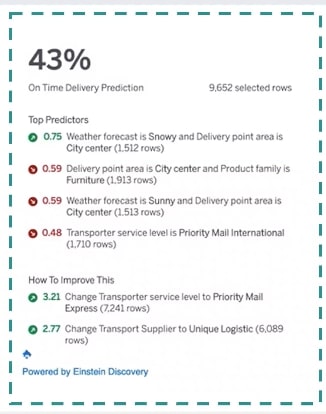
On the dashboard, you’ll see the Einstein model with relation to the data Tableau presents. With the extension itself, the data that the model will update as a filter or a dashboard action.
Enabling Einstein is done through Salesforce licensing, so you will need at least one license to access these models. Same with Tableau.
Tableau 2021.1 – Quick LODs
Most of us have written at least one LOD, but in case you haven’t, an LOD (level of detail) expression allows you to create a calculation at the granularity of the aggregation you are wanting to return with the calculation. They ignore filters because within Tableau’s order of operations, they are calculated before a dimension filter, unless that filter is added to context. So there is a lot of opportunity for LODs to become highly effective within your analyses.
Getting started with an LOD has never been easier. With quick LODs, begin by highlighting both a dimension and a measure—similar to what you’d do if you were using Show Me. Right-click, and under the Create menu, you’ll see the new LOD Calculation option:
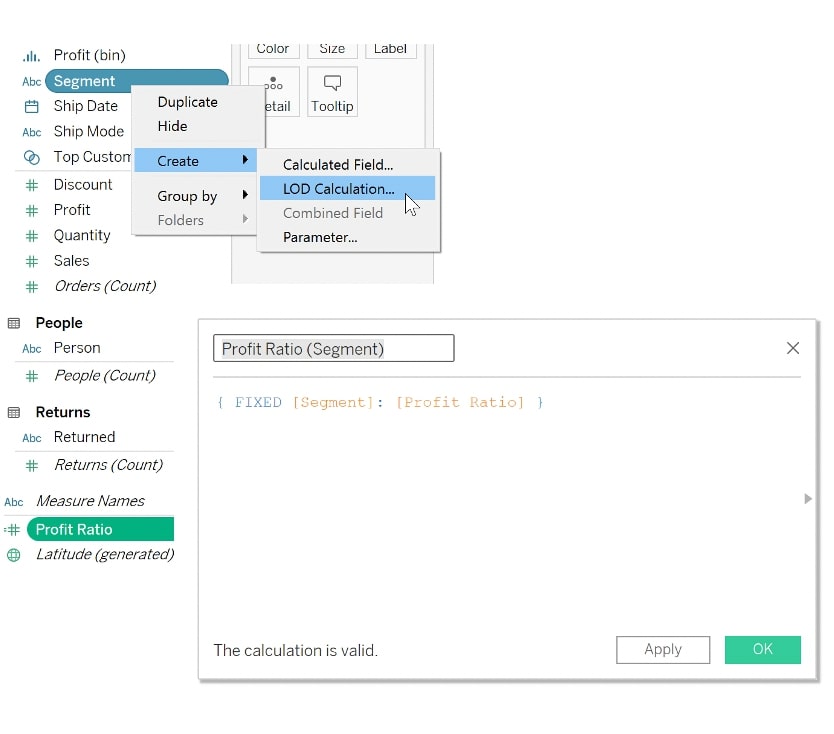
Now your LOD calculation will appear, allowing you to see that you’ve defined your granularity and aggregation. In the example above, I want to return the overall Profit Ratio by Segment. You’ll notice there isn’t a SUM, AVG or defined aggregation wrapping my profit ration because the calculation already defines it. But if that simply said Profit, you’d see an error needing attention to return an aggregate.
Need to add another granularity or dimension to this? No problem there. This is just to get you started. It’s not meant to solve everything with LODs, but it can provide you the ability to initiate the functionality to start an LOD.
Tableau 2021.1 – Ask Data
A couple of callouts here:
- The onboarding experience has most definitely improved with pop-up guides and some great, intuitive pointers.
- The feature gives you the ability to show you which fields get indexed without showing you every single field.
Tableau 2021.1 – Prep Enhancement: Excel & Salesforce Incremental
Tableau Prep has a new feature released with 2021.1: a new output option to Excel. In light of updates to Tableau Desktop in the last few releases to better export your formatted crosstabs, it was only a matter of time before Prep got some attention. In your output step, you’ll see now that there is a new option for .xlsx.
Also in Prep, since we were just talking about the alignment and integration enhancements of Tableau and Salesforce working together, there is a Prep enhancement related to this. That is incremental refreshes to Salesforce extracts with the Salesforce native connector. All you need to do is select the Enable Incremental Options and the field needed to know the last processed records.
More Tableau Resources and Webinar Recordings
Want more? Check out these great resources, and be sure to dive into the webinar replays below:
- What’s New in Tableau 2020.4
- Map Layers in Tableau 2020.4
- What’s New in Tableau 2021.1
- Einstein Discovery in Tableau
Webinar Replay – US
Webinar Replay – APAC
Webinar Replay – EMEA