Tableau purchased Power Tools in 2019. Contact Us for more information.
I had the opportunity to join InterWorks at the beginning of 2014 and play a key role in the launch of a brand new toolset called Power Tools for Tableau. At that point in time, there were not many third-party tools integrating with Tableau. We had several great ideas on how we could help not only the people who were creating lots of workbooks but also those who were managing them on Server.
All of this led to the creation of Power Tools for Tableau: Desktop (called Workbook Tools at the time) and Power Tools for Tableau: Deployment (previously called the Enterprise Deployment Tool). Both of those ended up having a significant impact on the way that Tableau was rolled out and managed in many organizations.
Evangelizing Power Tools for Tableau
In the first few years of making these tools available, we tried to find as many microphones as possible to get the word out to the Tableau community. I was one of several people on the InterWorks team to get in front of Tableau user groups of all shapes and sizes. We wanted to spread the word that we could help speed up some of the most challenging tasks, and we got the message out at roadshows, webinars, social media, conferences, random conversations, you name it.

Above: Talking Power Tools at TC15.
Fast forward to the beginning of last year (2016) and there were now several hundred organizations that were using our tools to help successfully grow and manage Tableau. We had succeeded in our mission of spreading the news far and wide, and there was no question that we had a captive audience who wanted to partner with us in making Tableau the best it could possibly be in the enterprise.
Reverse Engineering (a.k.a. Listening)
As the year progressed, we didn’t want to assume that we had a monopoly on the best ideas for creating new functionality that was integrated with Tableau, so we decided to get back out on the road and spend time with the various Tableau user groups again.
It would look a little different this time around. Instead of going into monologue mode on our latest and greatest functionality, we wanted to spend more time listening and gathering input in a collaborative workshop environment. Our goal was to get a bunch of people together who were responsible for being Tableau champions in their organization. We wanted to hear about their key victories and their key challenges.
Our first round of workshops took place in New York; San Francisco; Chicago; Washington, D.C.; London and Austin. Each of these workshops became an incubator of ideas that were all over the board, but we started to notice several consistent themes that emerged amongst the participants. The most notable takeaway was that every single city we visited had a strong consensus that the greatest area of need was timely answers on Server performance.

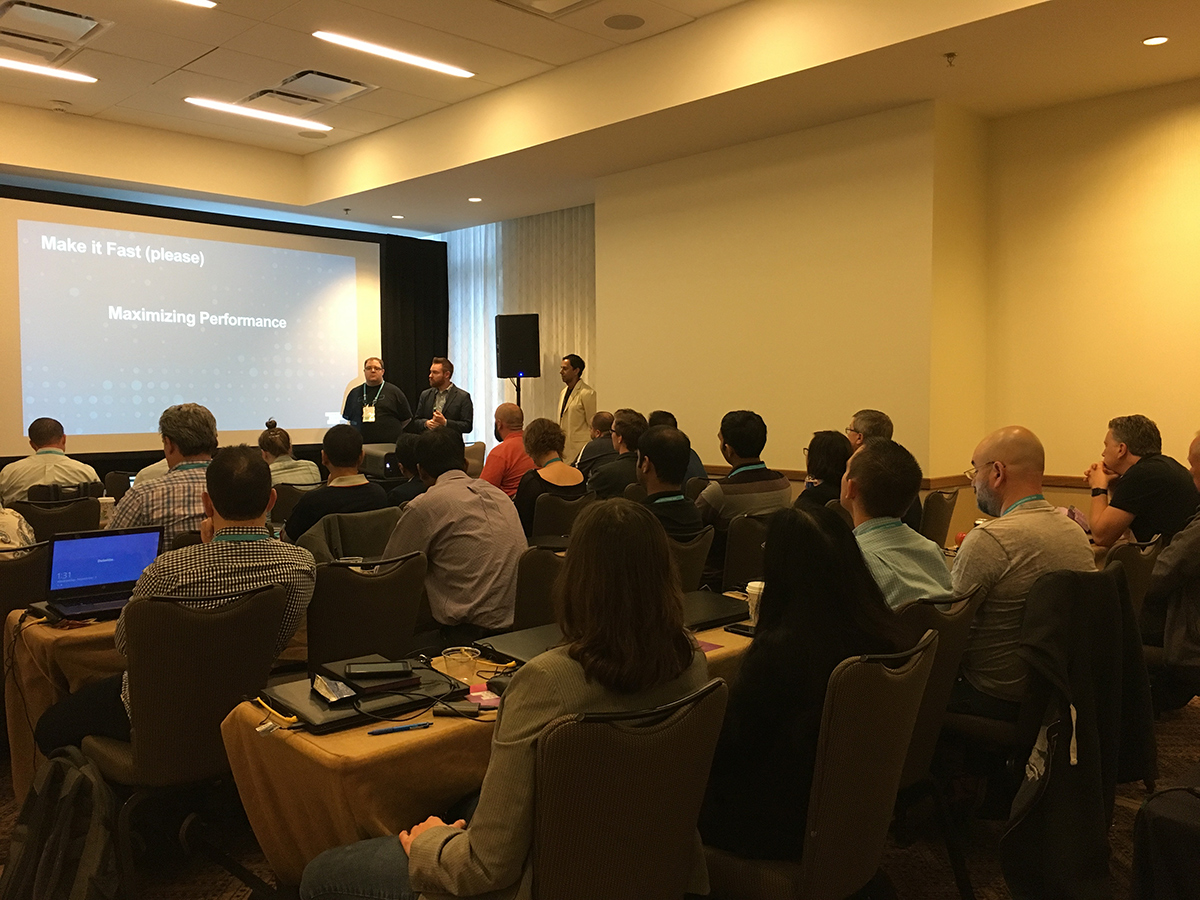
Above: A Power Tools for Tableau: Server workshop in San Francisco.
The answers they were seeking were often delayed by hours (and sometimes days). The worst-case scenarios took weeks to uncover exactly what was taking place with their performance challenges. That was unacceptable to them.
I brought their feedback to our development team who was actually in the process of building a new server monitoring tool that would be integrated with Tableau Server. We honed our efforts based on the workshop discussions. The team worked rapidly to incorporate new functionality over the months that followed, and we released this new tool (called Power Tools for Tableau: Server) at the end of 2016 at the Tableau Conference in Austin.

Above: Power Tools highlighted at one of our TC16 sessions.
Reception by the Tableau Community
It’s been exciting to see the responses from server admins around the world who’ve started using Power Tools for Tableau: Server. Several of them have shared nightmare stories from the past where they wasted countless hours trying to Sherlock Holmes their way through frustrating scenarios (where performance issues were difficult to quickly narrow down).
They are now seeing dashboards in a web application that displays hardware and software performance history in a single screen. They are also now getting real-time customized alerts about important server incidents. Stress levels are already on their way down with such a comprehensive Server monitoring tool at their disposal.
With all the time and money invested in Tableau Server, everyone wants to know they’re: 1) getting a return on their investment and 2) not wasting time with getting answers about performance and user adoption.
We’d Love to Show You More!
If you are looking to address the concerns mentioned above in the months ahead, please let our team know. That’s exactly why we built Power Tools for Tableau: Server, and we hope that you’ll get the chance to check it out soon.

