
Have you ever wanted to hide some of your data but not filter it? In this article, I will demonstrate how to hide certain pieces of data without filtering them out of the calculation results. I’ll be using a method that involves level of detail (LOD) calculations. I will also compare this method to the more classic method of using table calculations to hide data.
The Problem
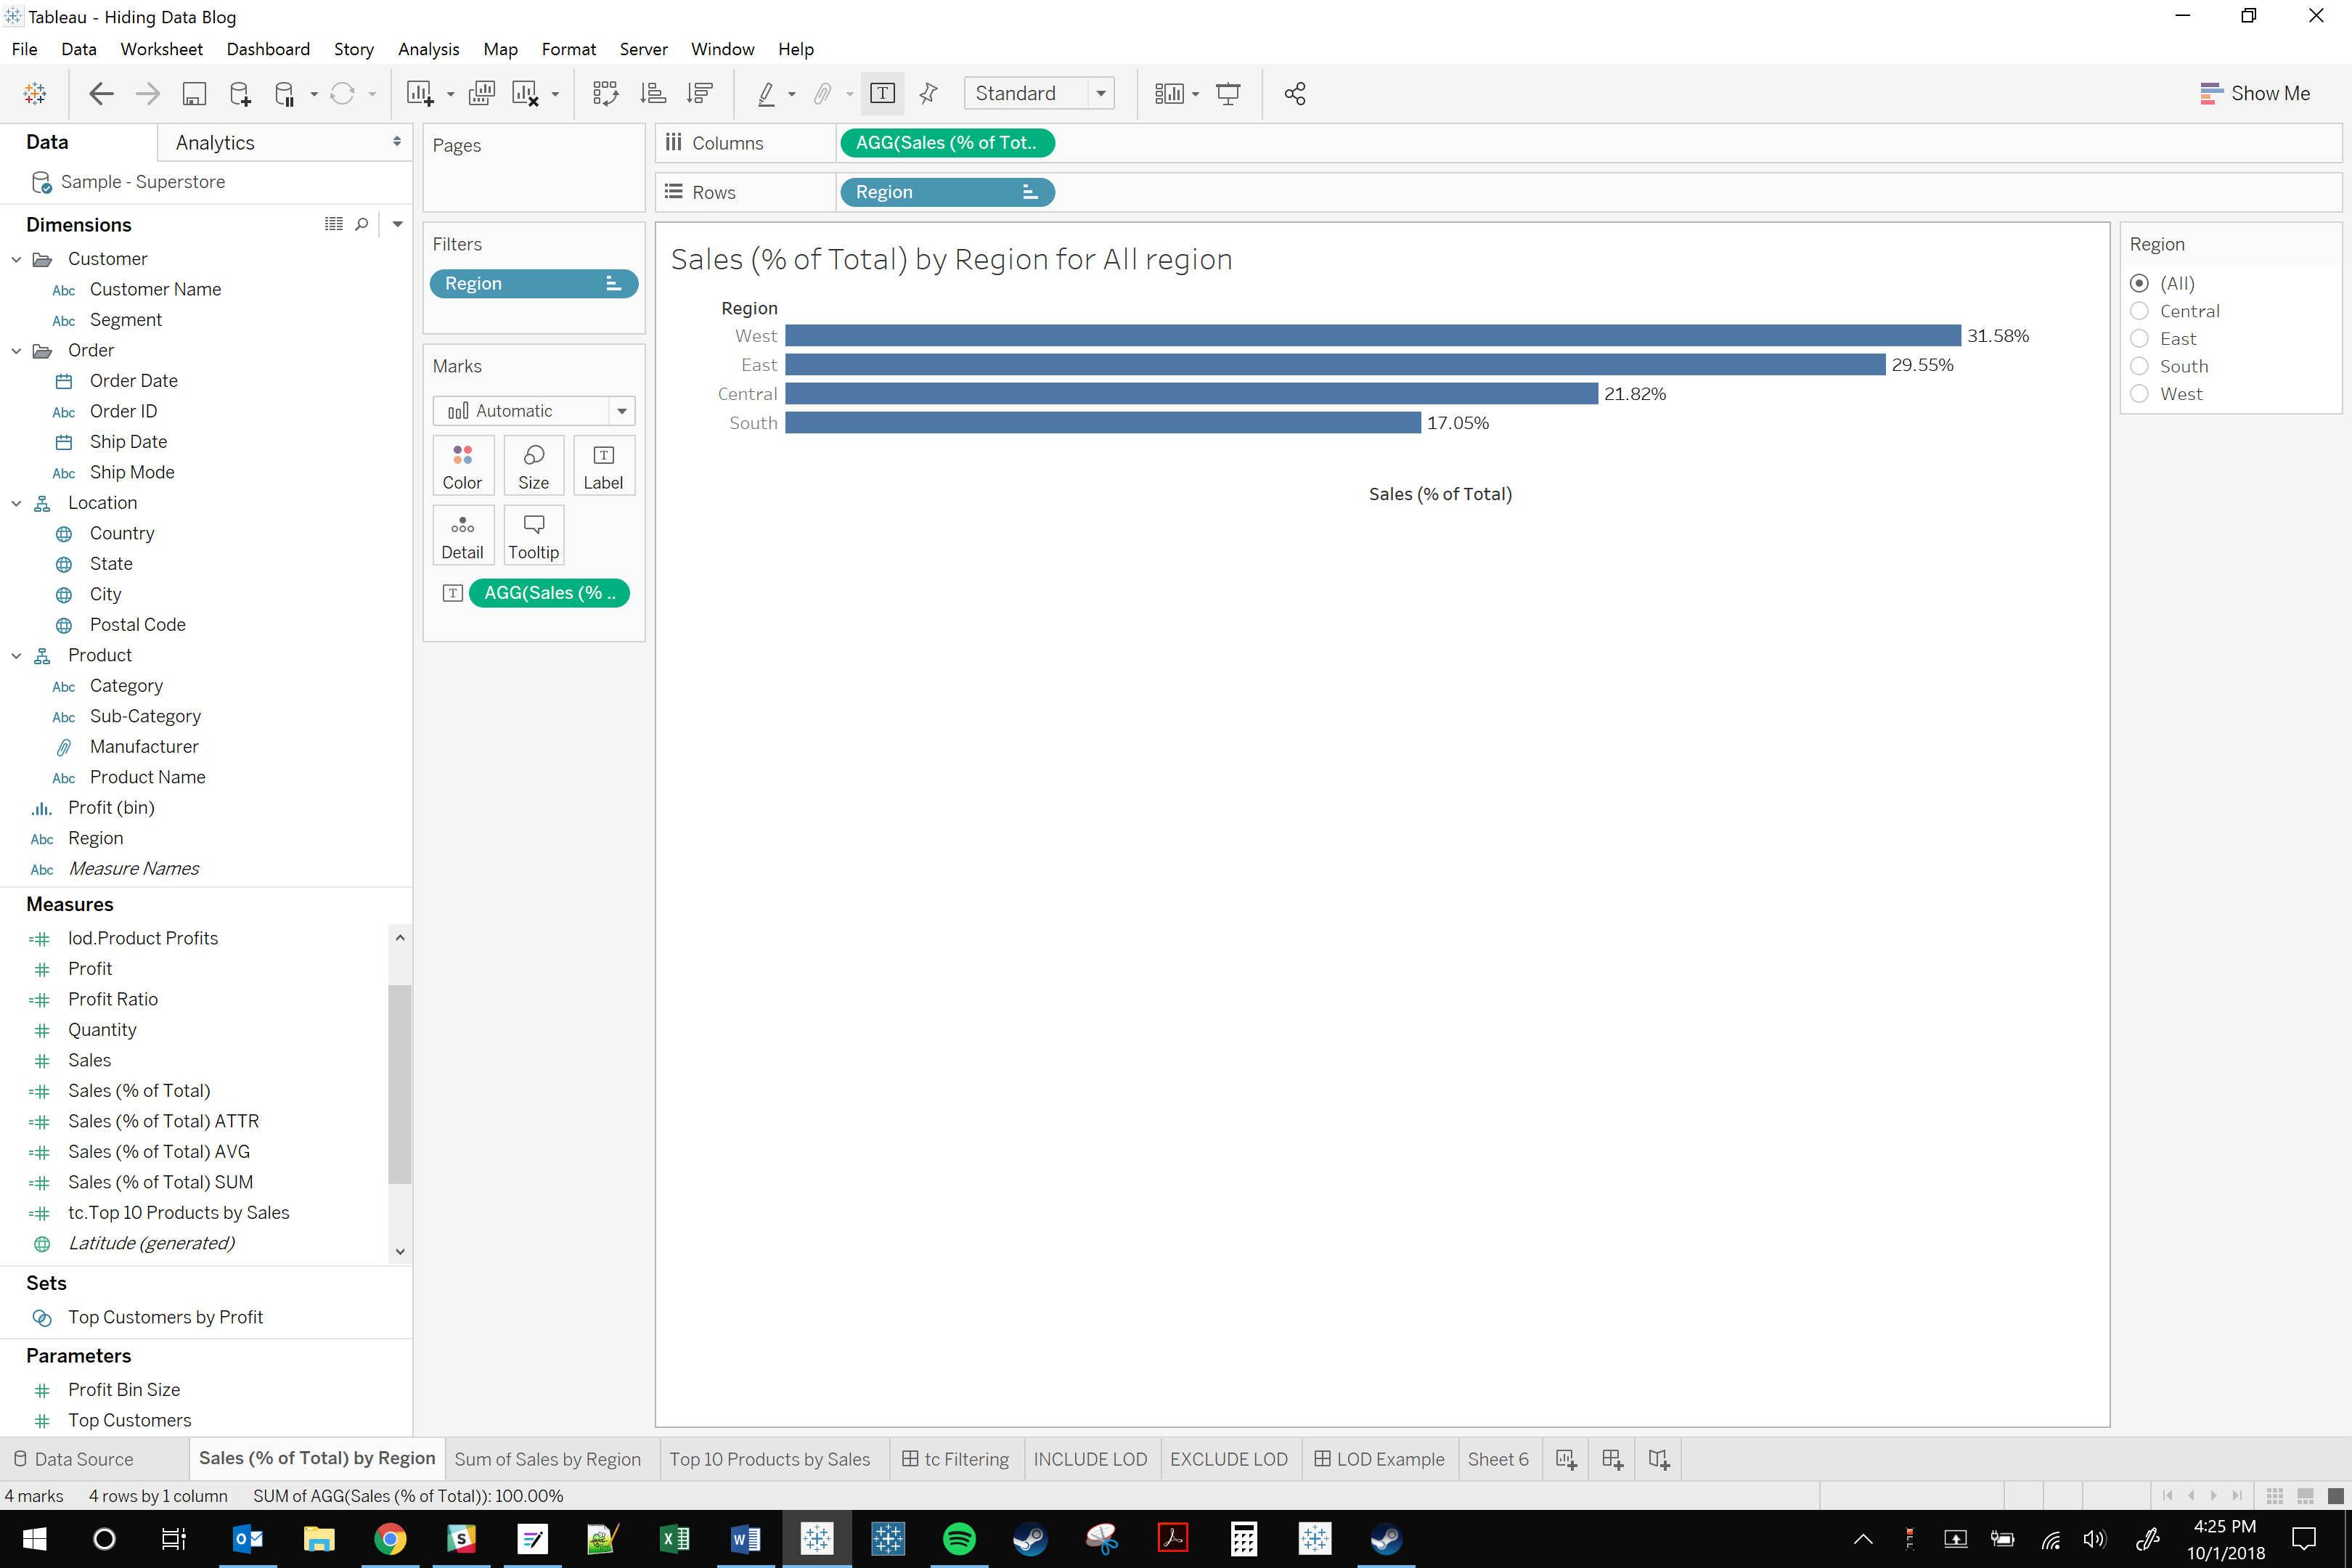
Let’s start with a practical scenario. Often, I hear from my clients, “I’d like to see my region’s sales as a percent of total company sales.” “Great,” I say, and I build them something like the chart below.
Note: I’ll be using Tableau’s Sample Superstore dataset in all my examples, so you can follow along.
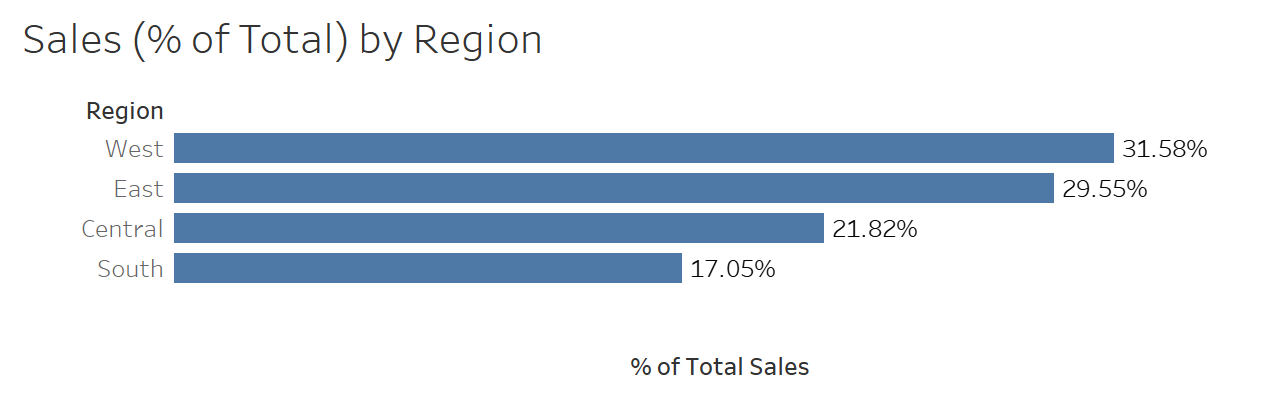
My client then says, “Okay, but can you show me just my specific region?” Here is where things start to get a bit tricky. Let’s say my client oversees the East region. If I drag the Region field to Filters and set it equal to East, then I will just see a single bar for the East region. However, the percentage of total sales will go from 29.55% to 100%. This is because Tableau is truly filtering the data to just the East region. What my client actually wants is to hide all of the other regions while still including their data in the percent of total calculation. They want to see something like this:
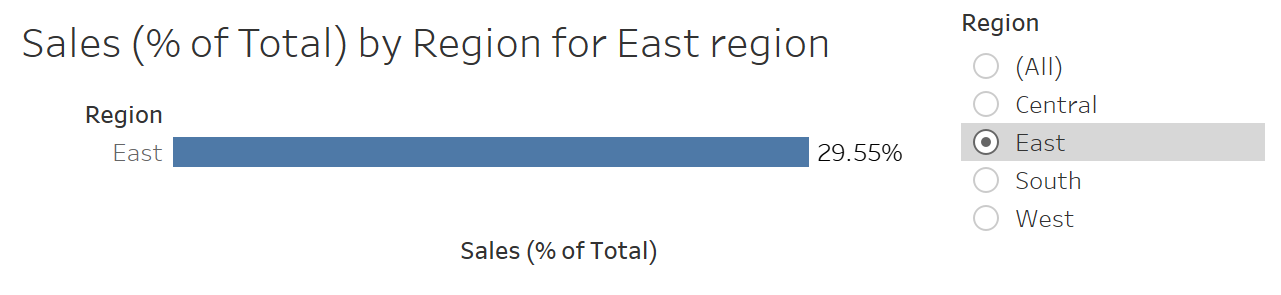
Now, the client will only see the region they have selected, but the percent of total calculation still includes the data from the other regions. This is a simplistic example, but the need to include data in calculations without actually showing that data comes up all the time when I’m consulting with clients.
The Solutions
There are two main ways to create this “hiding” functionality in Tableau:
- Use table calculations as filters
- Use FIXED LOD calculations in combination with other filters
Depending on the specifics of the scenario, there may be alternative methods, but the two listed above are by far the most common and versatile. Most of this article will focus on using FIXED LOD calculations in combination with other filters, but I’m going to start with an overview of using table calculations as filters.
Table Calculation Filtering
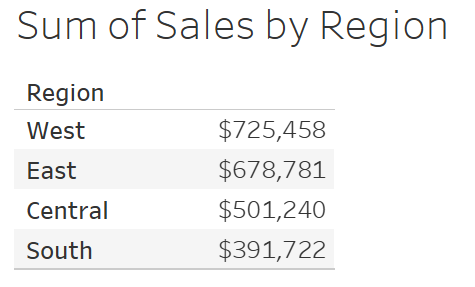
The method of using table calculations as filters to “hide” data has been around long before LOD calculations were even introduced into Tableau. To use this method, you need to understand that table calculations are performed based on the results of the primary query. Let’s use my initial example for illustration:
In this example, Tableau issues a query (question) to the data source which basically says, “Give me the total sales for each region.” The data source, which includes thousands of records, only returns four numbers: the total sales for each region.
The process isn’t finished, though, because I’m asking Tableau for the percent of total sales. So what Tableau then does is called a table calculation because it is a calculation performed on the table of initial results. In this case, Tableau uses only the four numbers returned to calculate the percentages of total sales for each region.
Now that we’ve established what table calculations are, we need to also know a bit more about Tableau’s order of operations before we demonstrate hiding data with table calculations. Knowing the order of operations for Tableau will also be important when we talk about using LOD calculations to hide data. Below is the order of operations for Tableau:
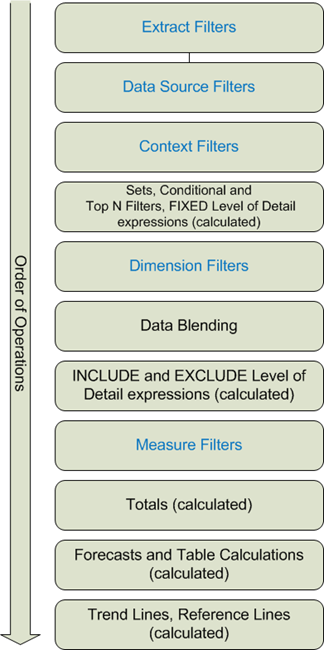
Notice that table calculations are performed near the bottom. This means all the interactions between the data source and Tableau have already been completed. So, what does this mean when we’re filtering using a table calculation? Basically, it equates to “hiding” the data points that are being filtered out. Let’s look at an example of using table calculations to hide data. Using the Sample Superstore dataset, I want to create a “Top 10 Products” list that gives their sales as a percentage of sales for all products. Typically, we would create something like this where we’re filtering on Product Name using a Top N condition:
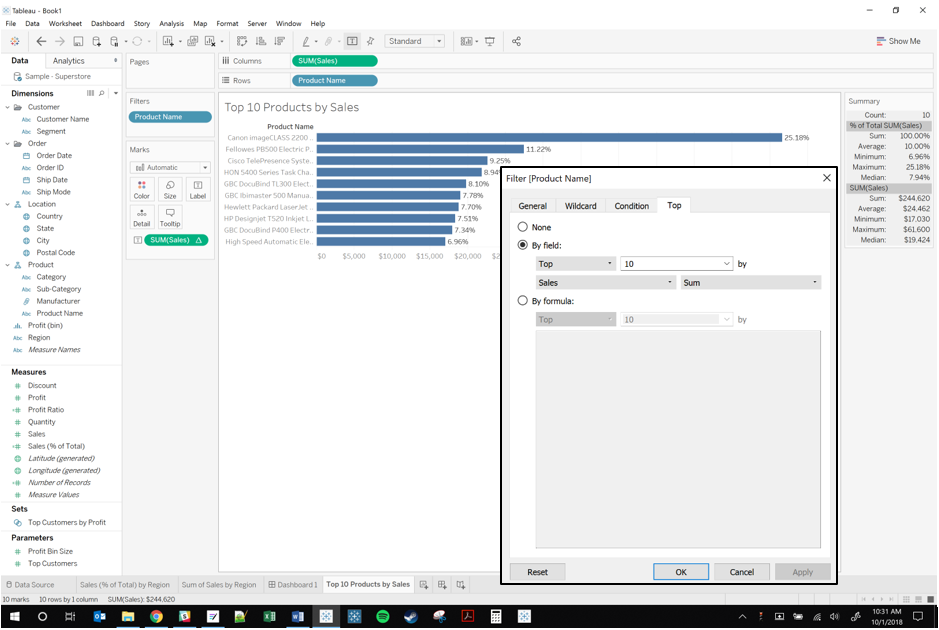
The problem here is that the percentages are relative to just the top ten products, not relative to all products. We can see this because all the percentages add up to 100%. What we want is to include the sales for all of the other products in the percentage calculation but not actually show those products on the worksheet. Here’s when table calculation filtering comes in.
So here’s the plan: we’re going to create a table calculation that ranks all products by sales. We’ll then use that calculation as a filter, and because it is a table calculation, it won’t affect what comes back from the data source, but it will hide the products not in the top ten by sales. For the table calculation, we’ll use a rank calculation with the following formula:
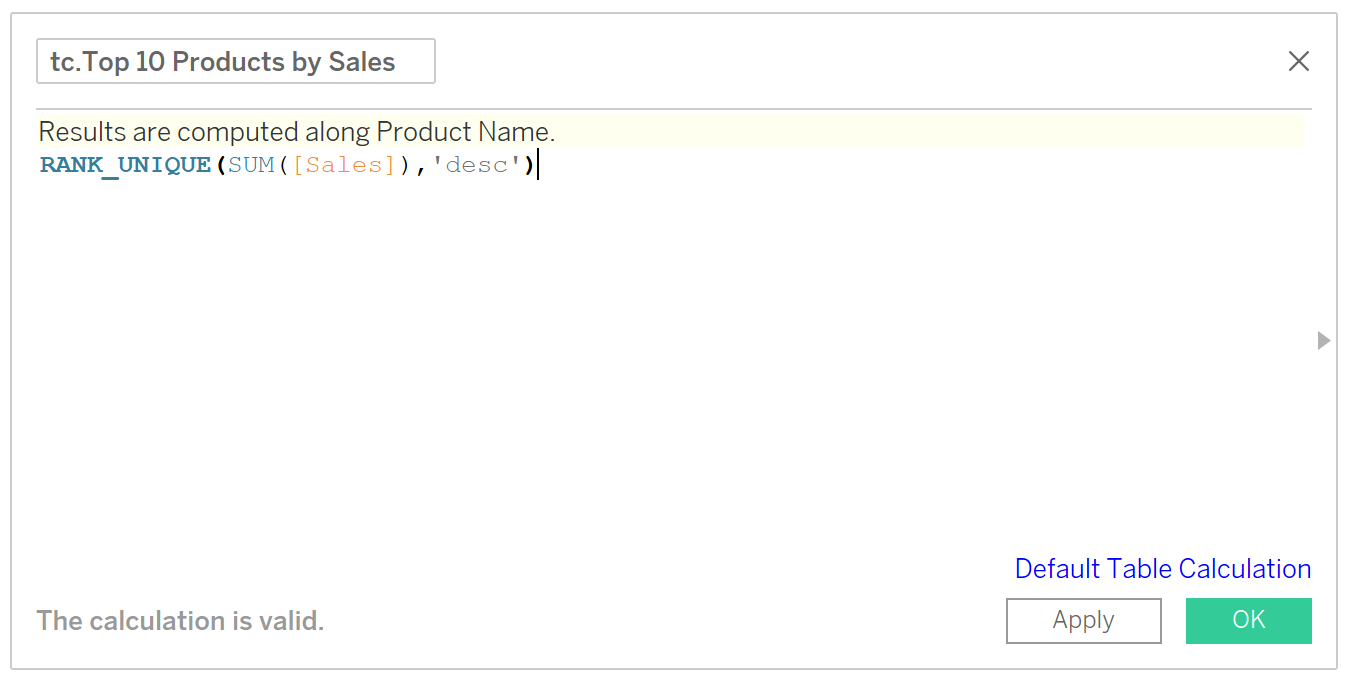
Next, we’ll swap the Product Name filter with this new calculation and set the filter range from 1 to 10. Our resulting worksheet still shows the same ten products, but it now calculates their percentage of total sales relative to sales across all products:
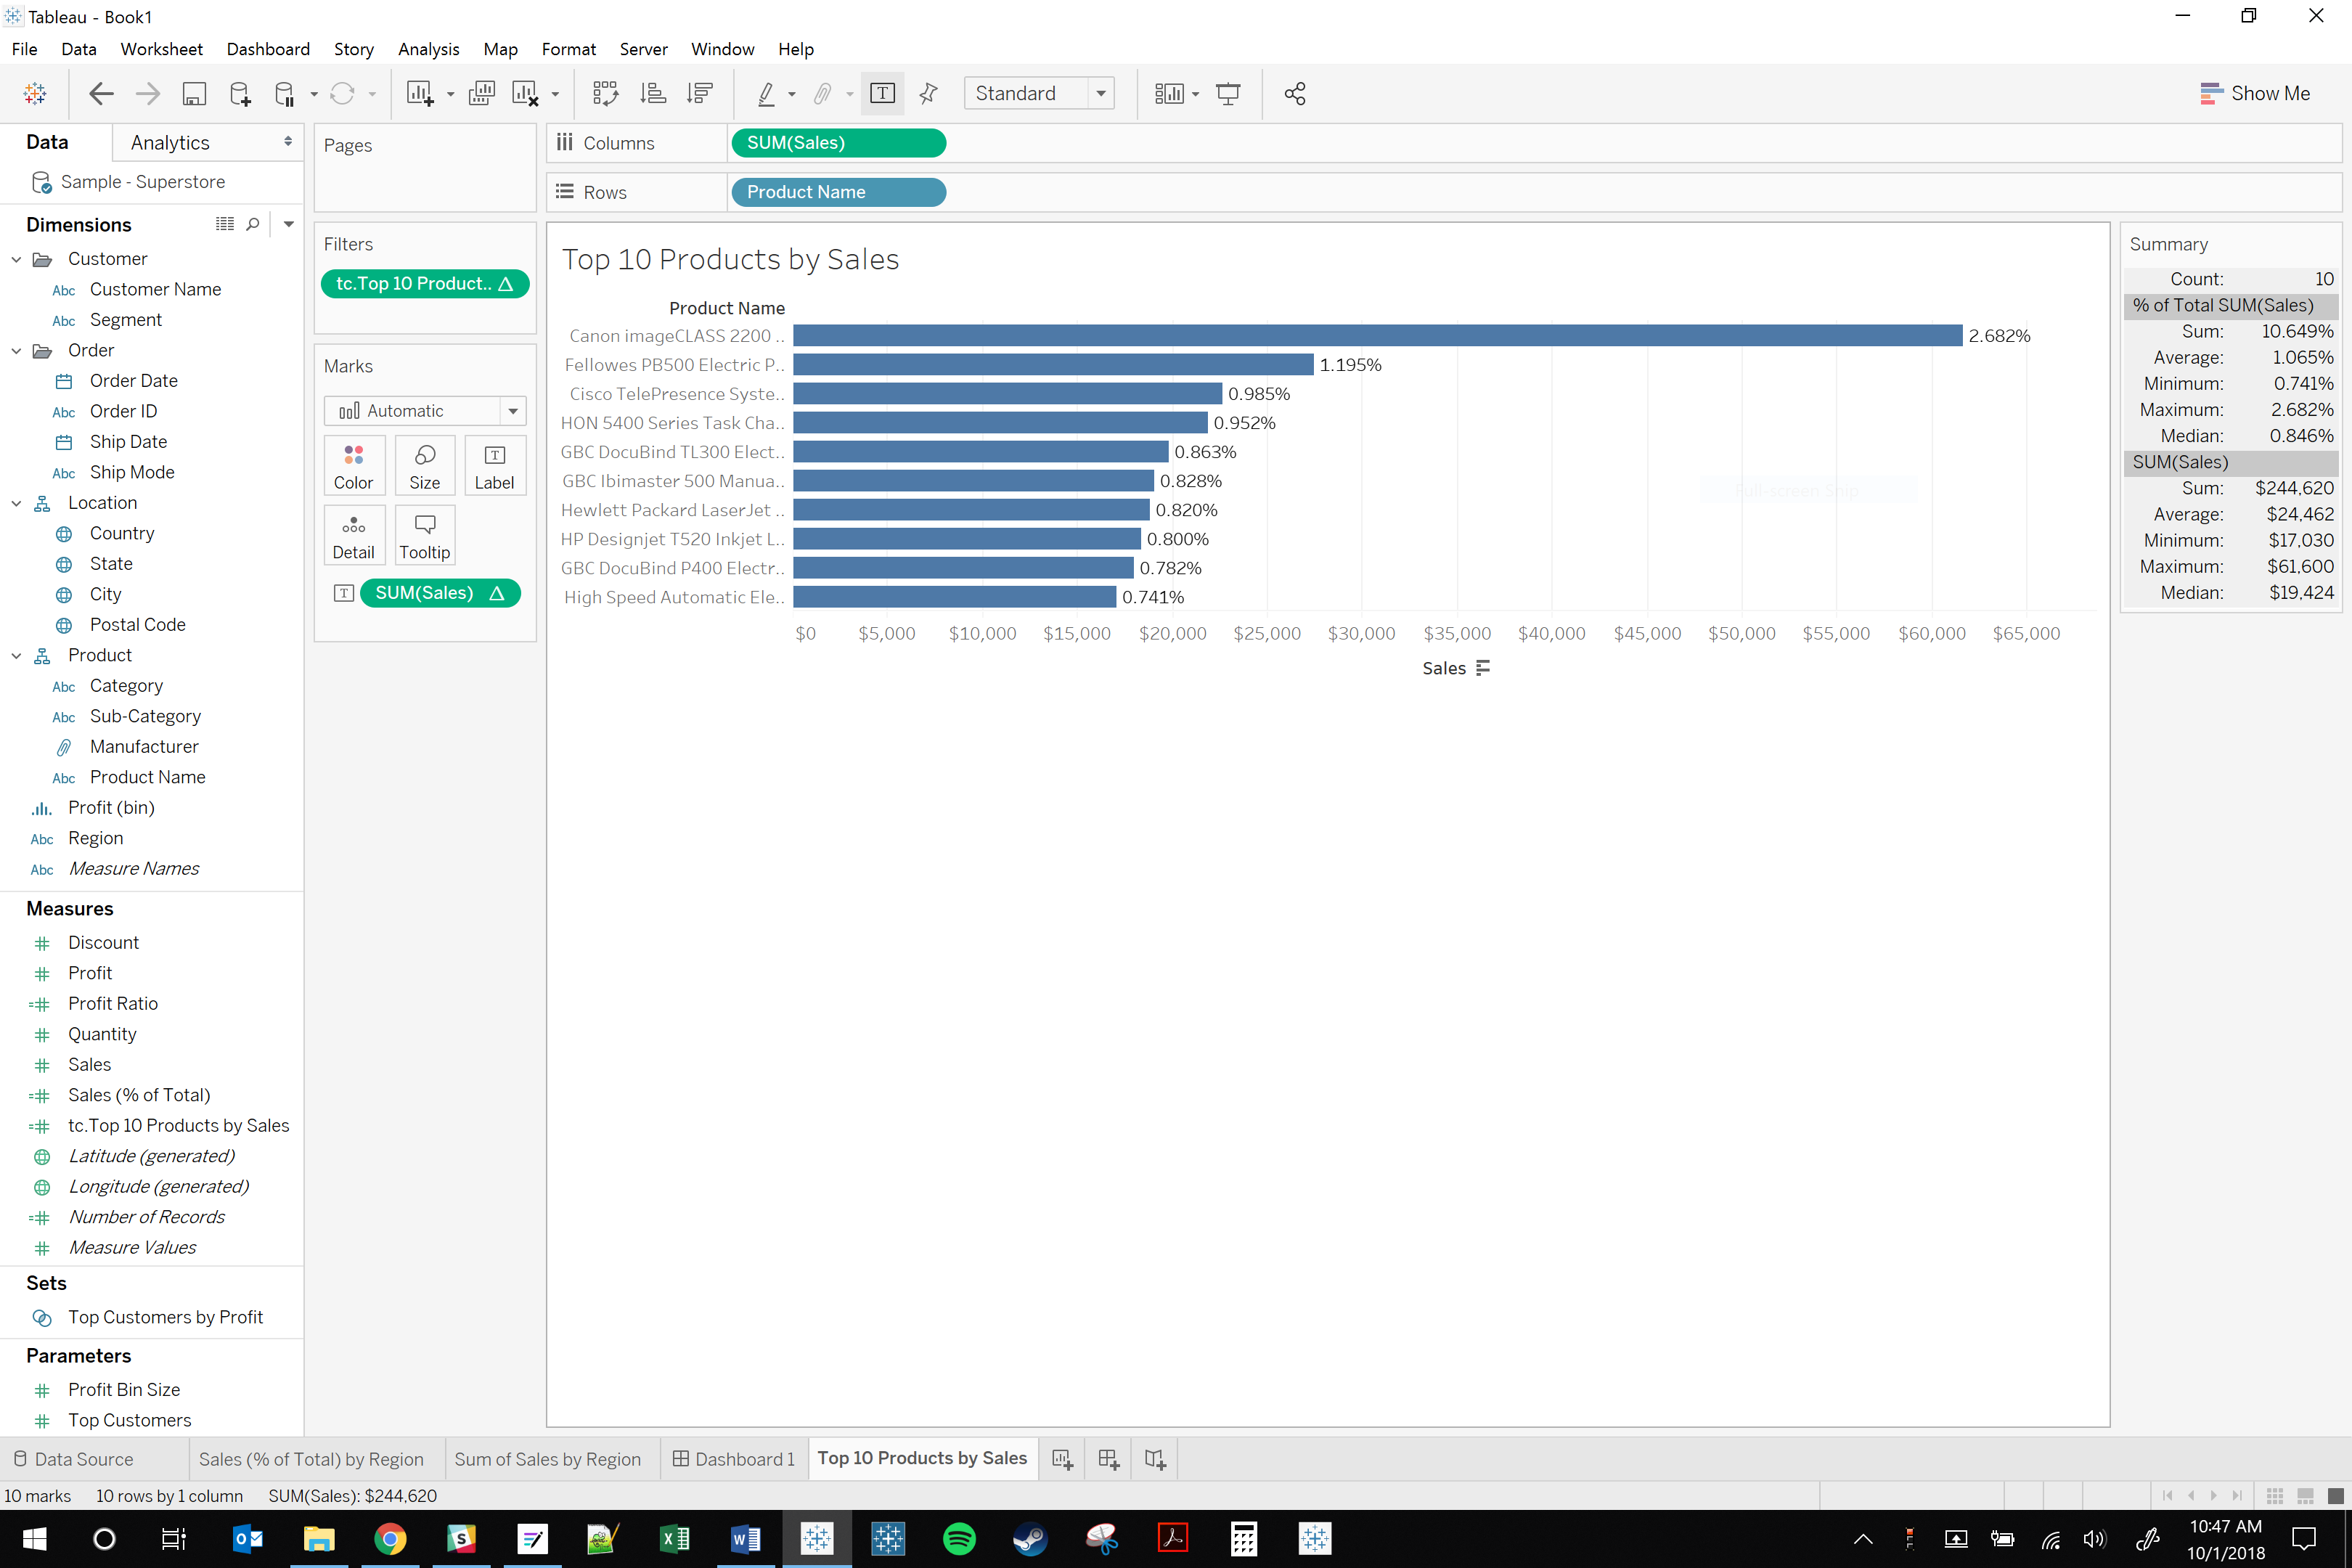
Pretty neat, huh? This method can be applied in a variety of ways and is still commonly used to “hide” data. However, the table calculations can be a little tricky to set up and are limited to what the primary result dataset allows. This is, however, not a limitation when using LOD calculations to “hide” data.
Hiding Data Using FIXED Level of Detail Calculations
LOD calculations have been around since Tableau 9. For those of you who aren’t familiar with them, they are calculations that are computed at a level of detail or granularity that is independent of the view. There are three types of LOD calculations:
- FIXED: sets the level of detail for a calculation regardless of what is shown in the view
- INCLUDE: adds details into a calculation that aren’t present in the view
- EXCLUDE: ignores details present in the view for calculation purposes
For those of you familiar with SQL, think of LOD calculations as queries where you control the GROUP BY clause. I think a quick example would be helpful. In the dashboard below, there are two bar charts. Each one shows the sum of sales by Sub-Category but with its own twist:
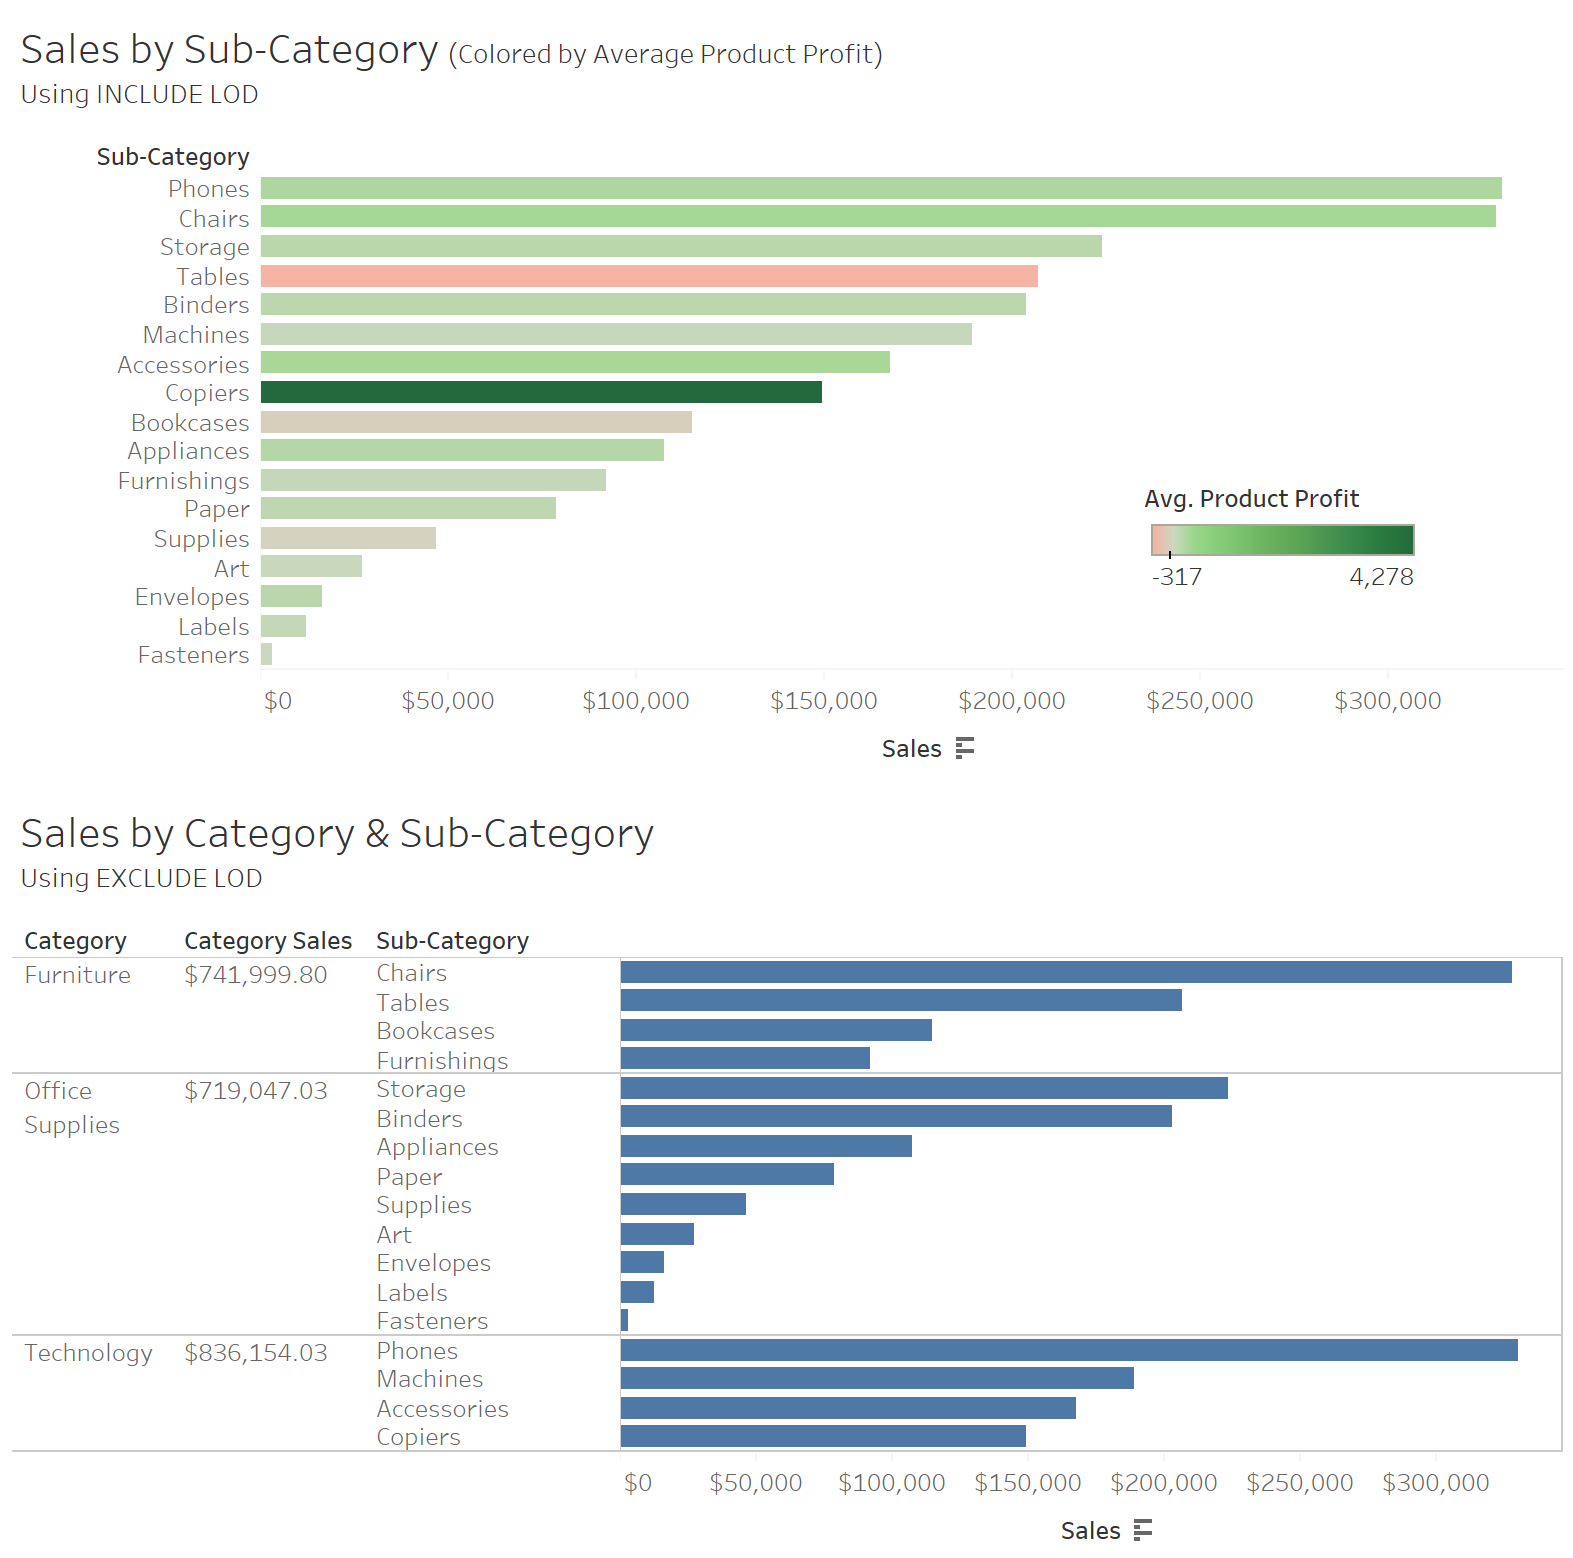
In the top chart, the bars are colored by the average total profit across the products within that Sub-Category. Notice though that the Product Name details are not anywhere in the view. The product-based coloring is accomplished by using an INCLUDE LOD calculation. The bottom chart also shows total sales by Sub-Category, but it gives the total sales by just Category. Even though the view is broken down at the Sub-Category level, using an EXCLUDE LOD calculation allows us to ignore the Sub-Category level of detail.
Now that you understand some basics about LOD calculations, we can move on to the meat of this article: hiding data using FIXED LOD calculations. I say FIXED LODs because INCLUDE and EXCLUDE won’t help us in this area. You might ask, “Why does one type of LOD calculation help while the others don’t?” The answer lies in Tableau’s order of operations, which we’ll look at again:
In this diagram, the light blue steps are filters. Notice that INCLUDE and EXCLUDE LOD calculations are computed after dimension filters, but FIXED LODs are computed before dimension filters are applied. What all this means is that we can compute our FIXED LOD calculations and then apply additional filters that don’t actually affect our FIXED LOD calculations. These regular dimensional filters thus appear to hide/unhide data while the FIXED LOD calculations are still computed using the full dataset. After a quick example, I’ll show you why it is also important to note that context filters are computed before FIXED LOD calculations.
To start off, let’s go back to our initial example where the person who oversees the East region wants to see sales of only their region but as a percentage of total sales across all regions. First. we need to create the calculation. Level of detail calculations are always denoted by squiggly brackets {}. Here is the formula I used:
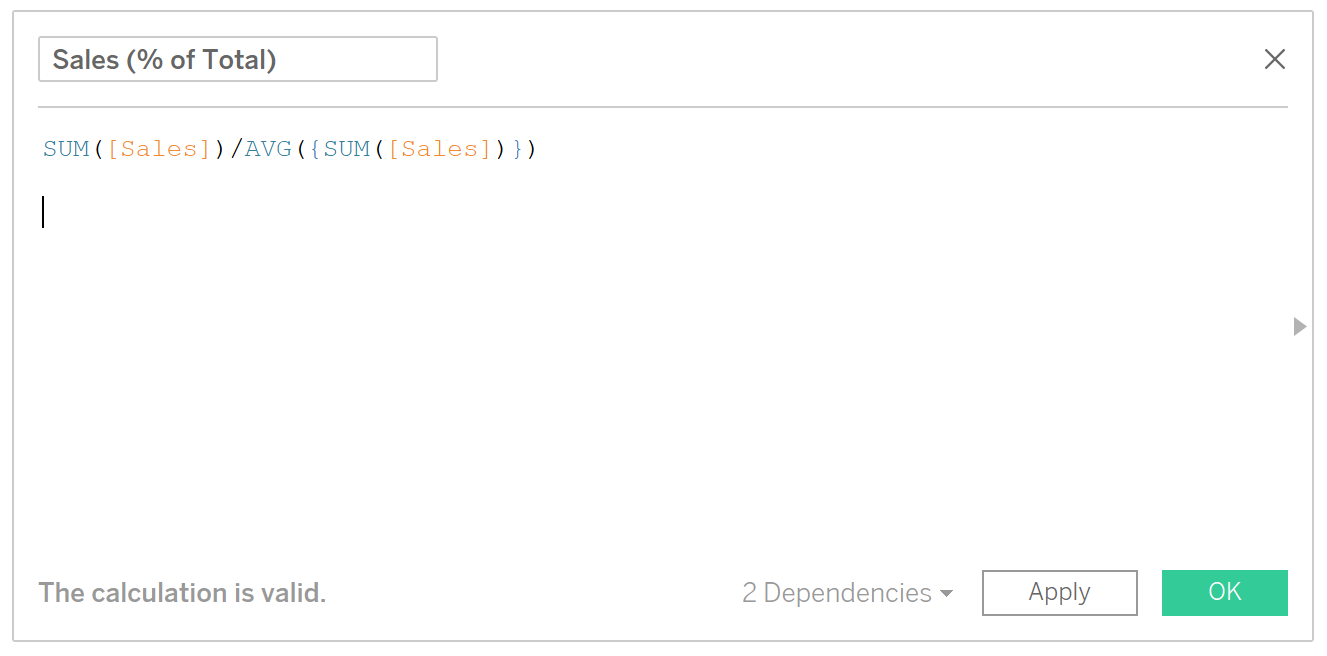
This formula takes SUM(Sales) for each point (in this case, each region) and divides it by the SUM(Sales) for the entire dataset. I want to address two potentially confusing syntax issues. First, you will notice that none of the LOD keywords are shown. When you don’t see FIXED, INCLUDE or EXCLUDE inside the squiggly brackets, just know that Tableau is using a FIXED LOD calculation for the entire dataset. Tableau calls this a table-scoped calculation. Secondly, the reason we have to aggregate the LOD calculation is because LODs have the potential of being at a greater level of detail than what is in the view. Consequently, Tableau requires that you tell it how to aggregate the LOD calculation should it be more detailed than what is in the view.
Now, let’s create the view. Drag the Region dimension to the Rows shelf and also to the Filters shelf. Next, drag our new calculation to both the Columns shelf and to the Label section on the Marks cards. Once it is sorted, the resulting worksheet should look like this:
Notice that changing the filter selection doesn’t affect the calculation but rather simply hides the regions you’re not interested in. This is a cool trick, but if I stopped here, you wouldn’t get very far using this method in the real world until you encounter a big problem like, “How can you actually filter out data since the FIXED LOD calculation ignores regular filters?”
Using Context Filters to Filter Your Data
This brings us to the last and final piece of the puzzle: using context filters to actually filter your data. Before you start raising performance objections, yes, I know that context filters can come with a significant performance drag. I’ll get to more of that in my conclusion, but for now, I just want to cover how they can add additional filtering functionality when using FIXED LODs to hide data.
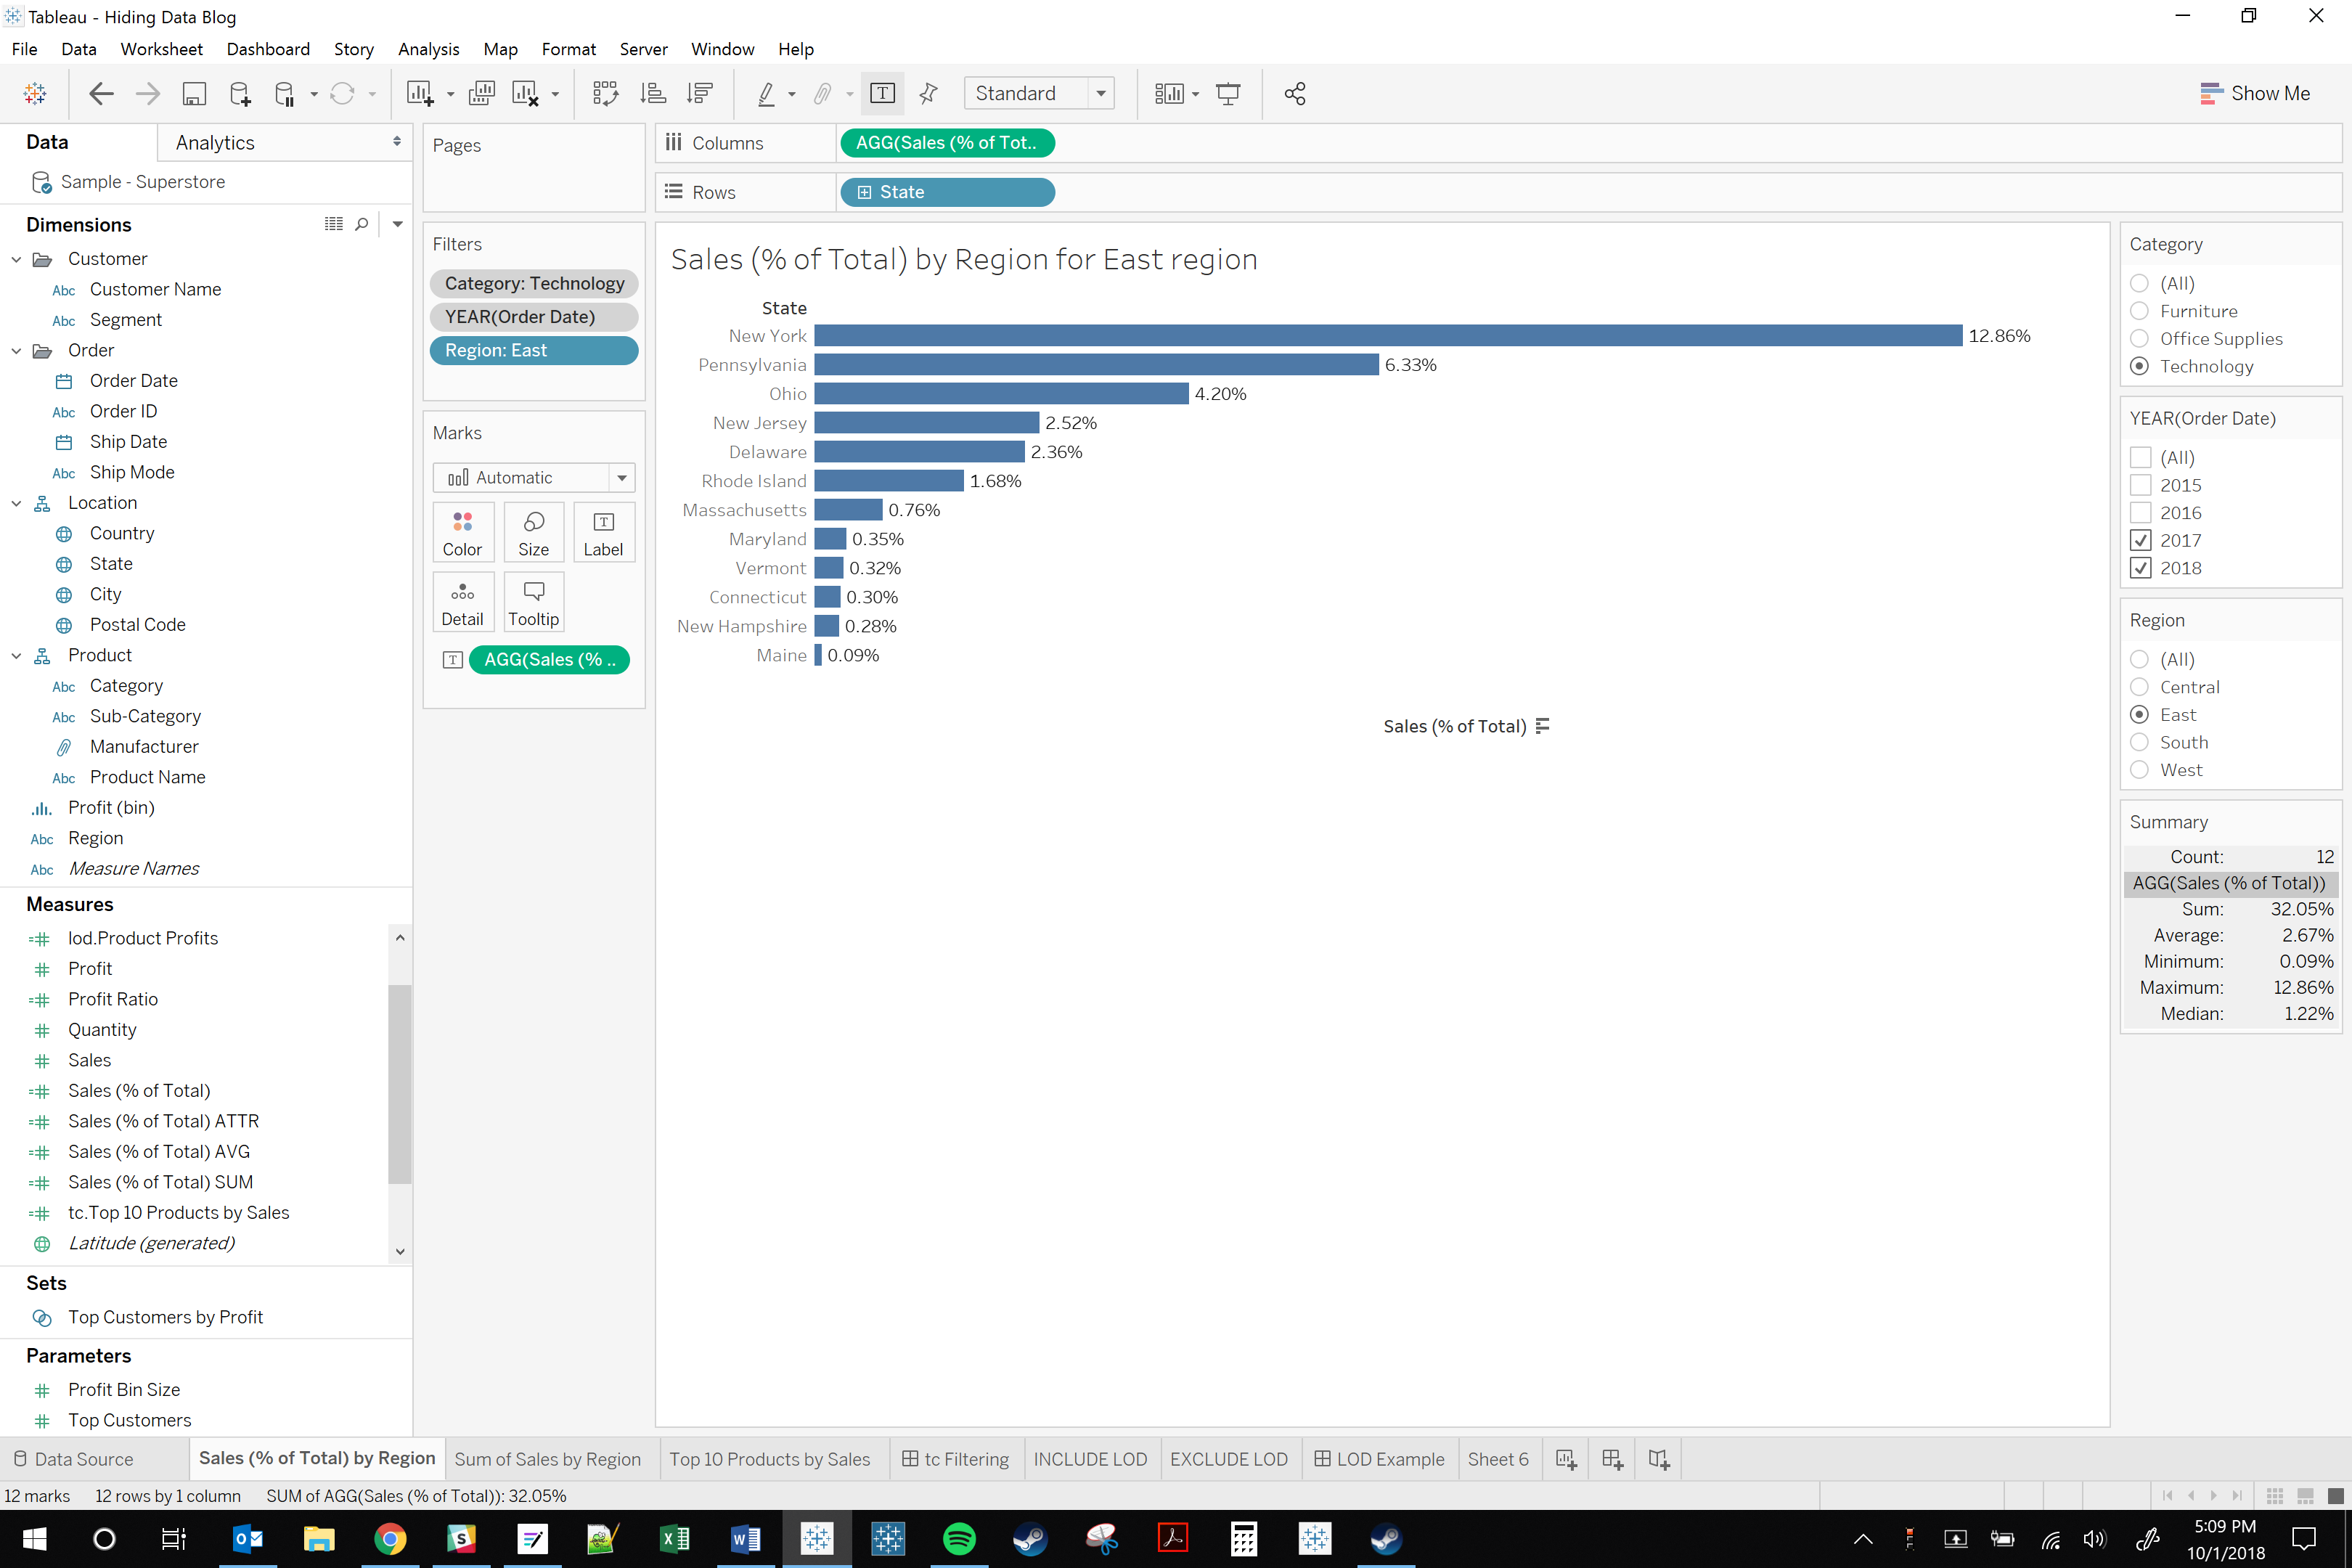
Let’s continue with the current example. We have a view that shows the percentage of total company sales for a region that the user selects. First, let’s replace Region on the Rows shelf with the State dimension in order to see, for a selected region, each state’s percentage of total sales throughout the entire company. But let’s say the user also wants to filter the data by Year and Category. Simply filtering by either of these fields will not do the trick because our FIXED LOD calculation is computed before the dimensional filters are applied.
Remember, though, from Tableau’s order of operations that there are filters that get enforced before FIXED LOD calculations are computed. These are extract, data source and context filters. Extract and data source filters cannot be controlled by the end user, but context filters can be. Given this, let’s drag the Category and Order Date fields onto the Filters shelf. Set the Order Date filter to Discrete Years. Finally, add them both to Context and show the filters. The resulting worksheet shows only the percentage of company-wide total sales for each state within the selected region for the selected Year(s) and product Category.
And that’s it! I know this was a simplistic example, but the mechanics of this method can be pushed to mind-numbing complexity.
Conclusion
You now know the two primary ways to “hide” data in Tableau. But which should you use? Well, like most things in Tableau, it depends. Here are some general thoughts to help guide you. Let’s start with using table calculations to hide data. For one, table calculation filters are usually a little easier to conceptualize and set up, especially if the view is straightforward. Additionally, if the data you want to show/hide is relative to the other results, table calculations already have built-in comparison functions, such as RANK(). Table calculation filtering can slow performance, but it is usually less of a performance drag when actual filters need to be enforced because the FIXED LOD alternative would then require the use of context filters.
Where table calculation filtering falls short in terms of hiding data is that advanced to complex views can be hard to structure in a way that the table calculation needs. Often, some Tableau “hackery” is required to structure the view in a way that the table calculation can be computed correctly. There are even cases where table calculation filtering cannot be implemented without visibly and/or functionally altering the view. Table calculations also aren’t as portable from view to view. When you spend a bunch of time getting a table calculation to compute correctly on one view, it would be nice if that work could carry over into building other views. Unfortunately, this isn’t usually the case. Bits and pieces of the table calculation may be re-used, but you still will likely have significant work to do to get it to filter correctly.
Versatility is where hiding data with FIXED LOD calculations really shines. For the most part, your FIXED LOD calculation can be dropped onto multiple views with only minor adjustments. Moreover, FIXED LODs can be computed correctly regardless of the structure of the view. Therefore, not as much “hackery” is required. This is valuable to Tableau users who may not know how to modify views in such a way that leaves the view looking the same but altered precisely so that a table calculation can be computed correctly. The potential big drawback with using FIXED LOD calculation to hide data is that it may come with a performance cost if true filtering using context filters is still needed.
I hope that this has been helpful. Please feel free to reach out to me or anyone at InterWorks for any of your data needs.