Tableau software is incredible in its own right, but it’s even more amazing once you actually understand all the words they throw at you in training. Most of it is pretty intuitive, and that’s exactly how Tableau wants it to be. But, there are a couple terms that completely threw me off. Learning their definitions meant the difference between me being like, “THIS IS AWESOME!” versus me being like, “Wait, what?”
Pills
The first of those terms was “pill.” I’m familiar with what I thought was the only two definitions:
- Something you swallow to make your headache go away.
- Something you call your kids when they are seriously getting on your nerves. Not that that ever happens to me.
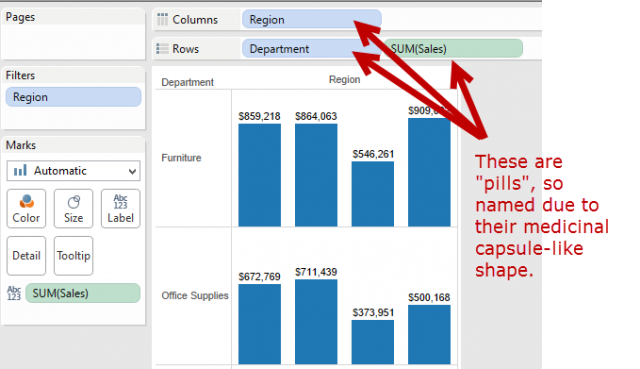
Color me confused when the trainers kept talking about dragging pills hither and yon. Here is what they mean by a pill:
A piece of data that you want to show up on your visualization, as seen below:

That’s it. That’s all there is to it. Pill = piece of data. Piece of cake!
Shelves
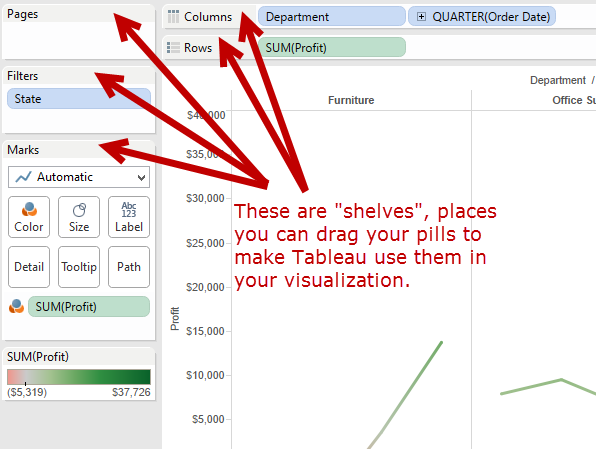
Now that you know what a pill is, you may be interested to know that pills can be dragged to a “shelf.” A shelf is an area on the visualization screen where you can drop pieces of data so that Tableau can act on them. What Tableau does with a pill depends on which shelf you drag it to.
Let’s take a look at a screen shot:

There are four kinds of shelves:
- Columns
- Rows
- Pages
- Filters
This post isn’t the place to get into the nitty gritty about the purpose of each shelf, but rather just to let you know what a shelf is and what you can do to it. [Note: Edited from prior version, with thanks to Joshua who commented that the Marks area is technically a card, and not a shelf. Thanks, Joshua!]
Dashboards
Finally, there’s this idea in Tableau of “Dashboards.” I’ve always assumed the term came from the automotive industry, where your dashboard shows you your speed, how much gas you have (or in my case, how much I don’t have) and how many miles you’ve gone – stuff like that. A dashboard then is a group of visualizations that consolidate individual pieces of information.
Worksheets
To continue the analogy, a “worksheet” in Tableau would be akin to the speedometer. Another worksheet would be the gas gauge and another would be the odometer. So, a dashboard in Tableau is a collection of individual worksheets that you’ve created and gathered into one bigger worksheet. This gives your audience a way to see all of the readouts that he or she needs in one glance. How complicated would it be to drive a car if you had to push a button to switch your readout from speed to gas gauge to mileage? It’d keep the car repair people in business, what with all the fender benders that would ensue! It’s the same thing with worksheets in Tableau. You want to give your audience access to the most important worksheets without them having to click tabs across the bottom of the window.
Now We’re Talking Tableau!
Learning new software is so much easier if everyone’s got a basic understanding of the terminology. These are the three terms that seem to get most people who are not coming from a database or data visualization background. What makes Tableau so powerful is its user-friendly interface. You don’t have to be a programmer or database administrator to use it! You just have to get a handle on a few terms here and there. Hopefully, this post will help get you up to speed.

