
Recreating an inspiring visualization is a great way to learn and stretch the limits of a tool. Recently, Andy Kirk reached out to Twitter followers looking to see if it’s possible to make a grid full of circles like this Nobel Laureates graphic using Tableau. Not only is it possible, it is easy to build with a few steps. Below are the original and my remake. You can also see Andy Kirk’s version on Tableau Public.
The original (click for live version):
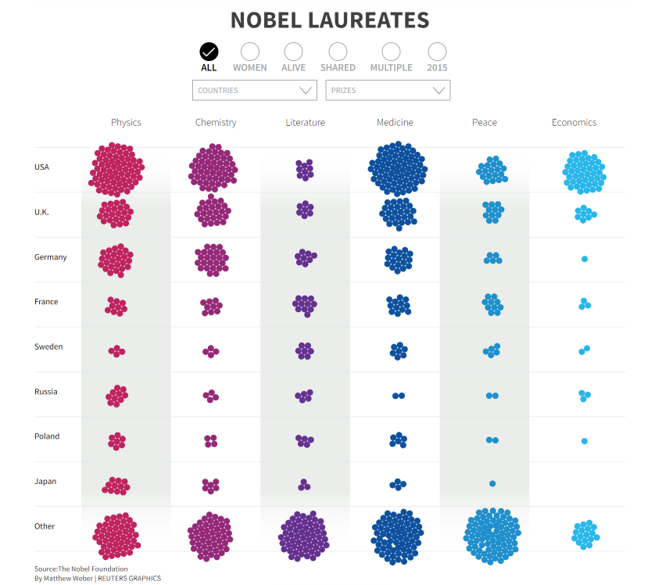
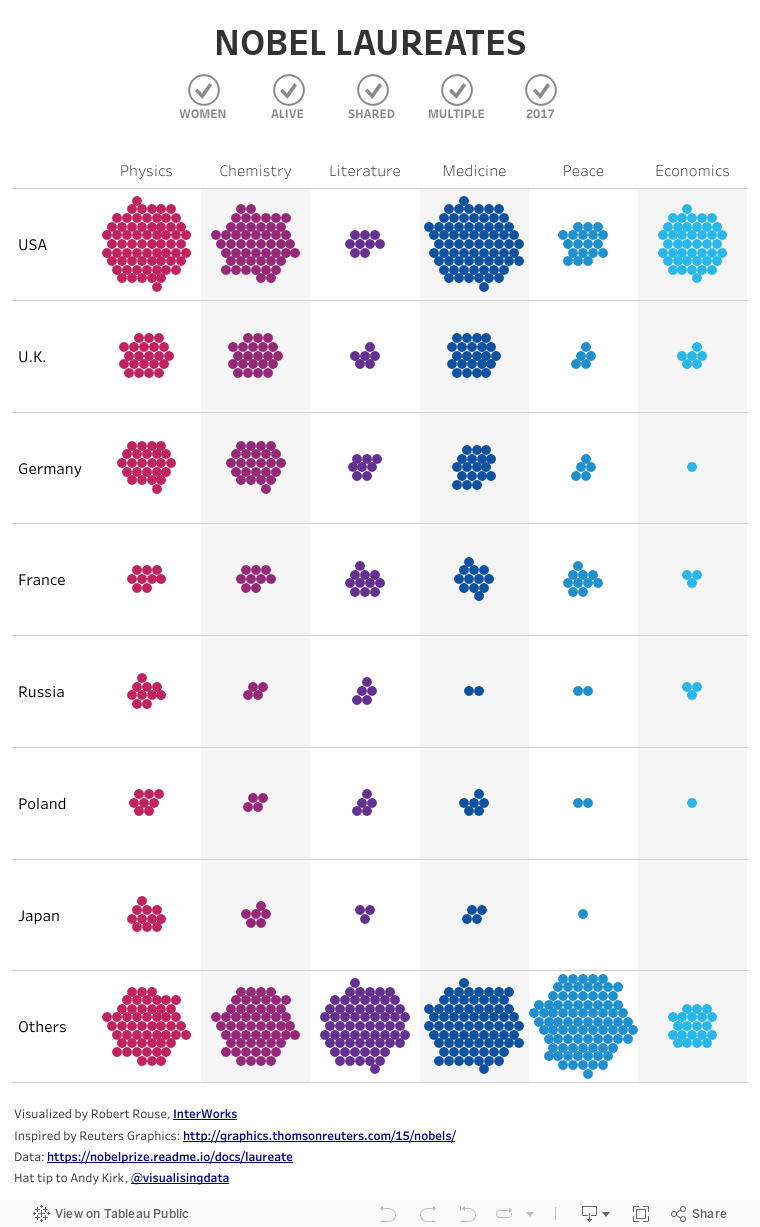
Tableau remake:
Making a Packed Circle Grid
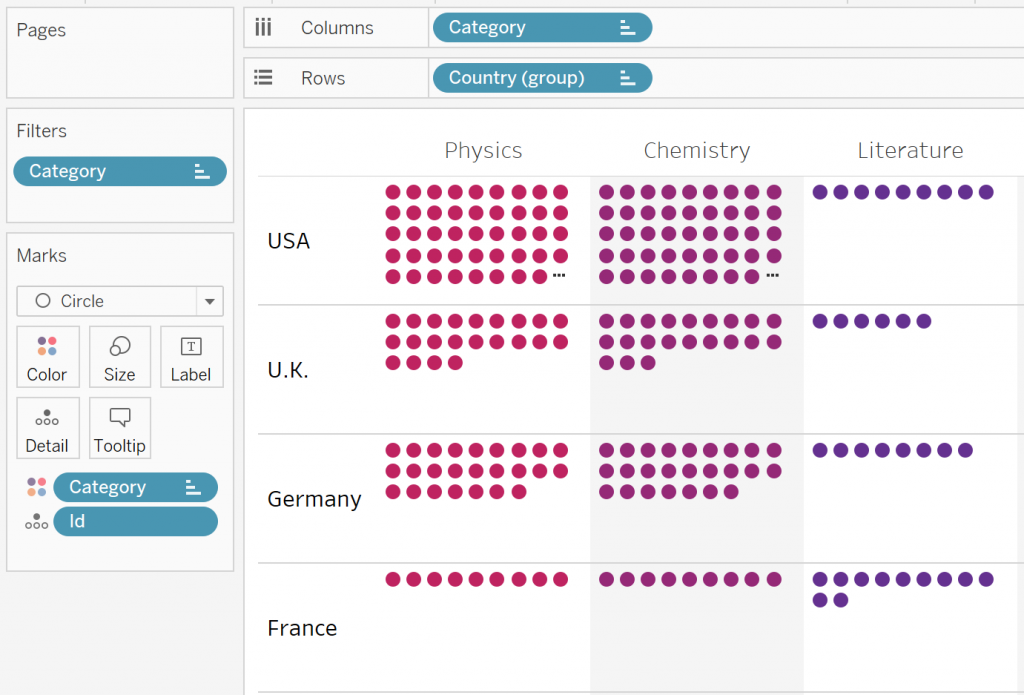
If you have a dimension on Rows or Columns and choose Circle as the Mark type, Tableau will arrange the circles along straight lines, not as floating bubbles, by default. This is how it looks:
Adding any continuous field to Size will tell Tableau to arrange them like a bubble chart instead. I decided to use a parameter called Size with a value of 1. If that field has the same value for all marks, the bubbles will display as equal-sized dots.
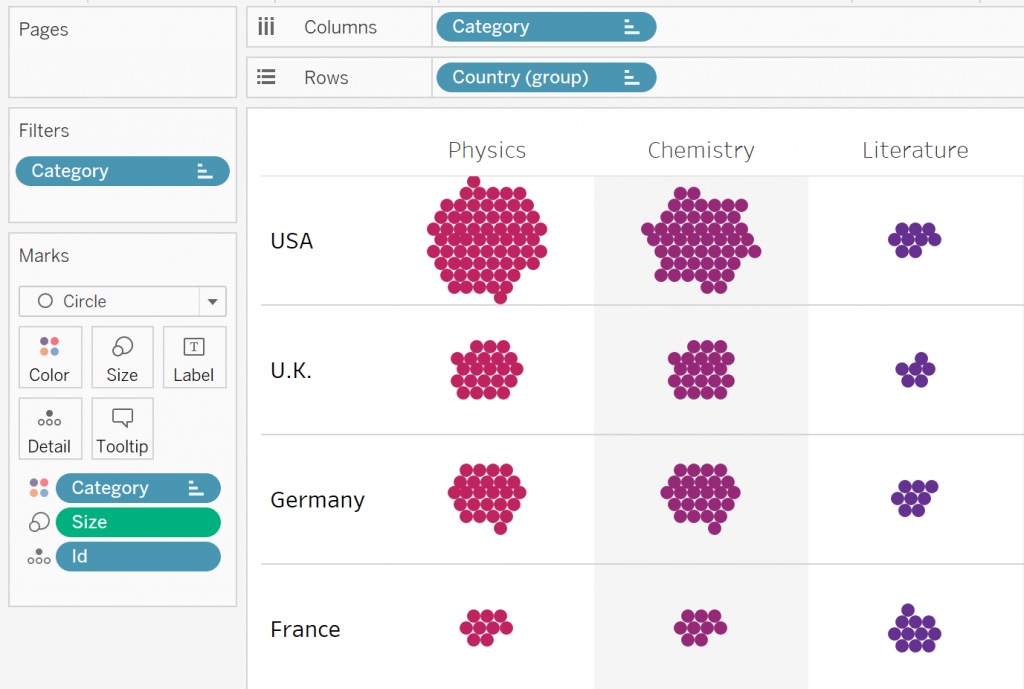
That’s all it takes to make this chart type in Tableau.
Adding Up Little Differences
I appreciate Andy’s series, “The Little of Visualization Design.” Small details make a big difference when they’re all put together. While this Tableau viz closely resembles the original, there are some details that can’t be perfectly replicated.
Bubble Packing Method
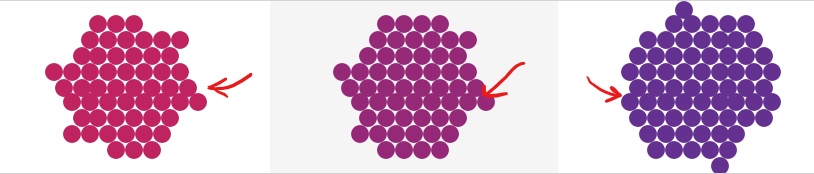
When every circle is an equal size, some “bubbles” may be closer to others. In some cases, a line of circles will touch each other. In others, there is a wider gap along a vertical or horizontal pattern. These areas are more obvious in larger groups of circles. Also, Tableau’s algorithm produces something closer to a pinwheel pattern than a nice circular group.
Checkboxes
It’s possible in Tableau to change the icon on a sheet when you click it, but it’s a complicated workaround that isn’t worth the effort in my opinion. In my version, the active selection is highlighted instead of making the checkmark appear or disappear.

Animation
Tableau doesn’t animate marks upon loading or filter change. In this example, I don’t think the animation adds much, but it is a limitation of Tableau over the original.
Custom Font
The Reuters graphic uses Source Sans Pro, available at Google Fonts. Since Tableau doesn’t render web fonts, I stuck with the default Tableau fonts as a close approximation.
Tooltip Sizing
I used Tableau’s viz-in-tooltip feature to achieve the black background on hover and limit the width. The downside is that the height is not dynamic, leaving some extra space at the top and bottom of shorter descriptions. It also leaves a white border which cannot be removed.
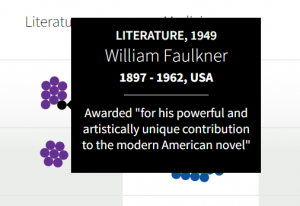
Original Tooltip |
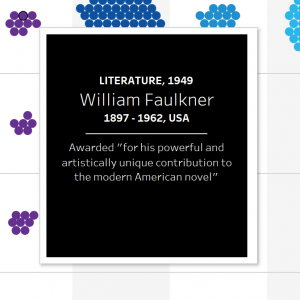
Updated Tooltip |
Column Gradients
Unlike the example visualization with gradients at the top and bottom of columns, the gray shading in Tableau is one solid color. The gradient adds some visual interest, but I prefer the sharper edges in this case. If you really wanted to, transparent backgrounds would make it possible to use a custom background image behind the data to achieve this effect.
Alternate Layouts
The original lets you choose whether to see affiliations, countries, prize categories or time. Dynamic layout choices are entirely possible in Tableau. I omitted those choices for the sake of time and illustration purposes.
All of these things add up to a less-than-perfect reproduction, but I’m pleased with how closely it matches in the main areas.