As another college football season draws to a close, the sport as a whole is in great shape. Ratings are high, and the revenues of individual programs are higher than ever. That said, there remain some areas for improvement – particularly when it comes to attendance..
Since 2011, attendance has been down 4.5% throughout college football as a whole. On average, FBS programs drew a crowd of 41,979 in 2015 – down from 43,935 in 2011. This decline can be attributed to a number of factors, including rising ticket prices and better options for watching on television. In addition, some of college football’s more traditional powers like Penn State, Michigan and Texas have been down recently, giving way to the likes of Oregon, Baylor and TCU.
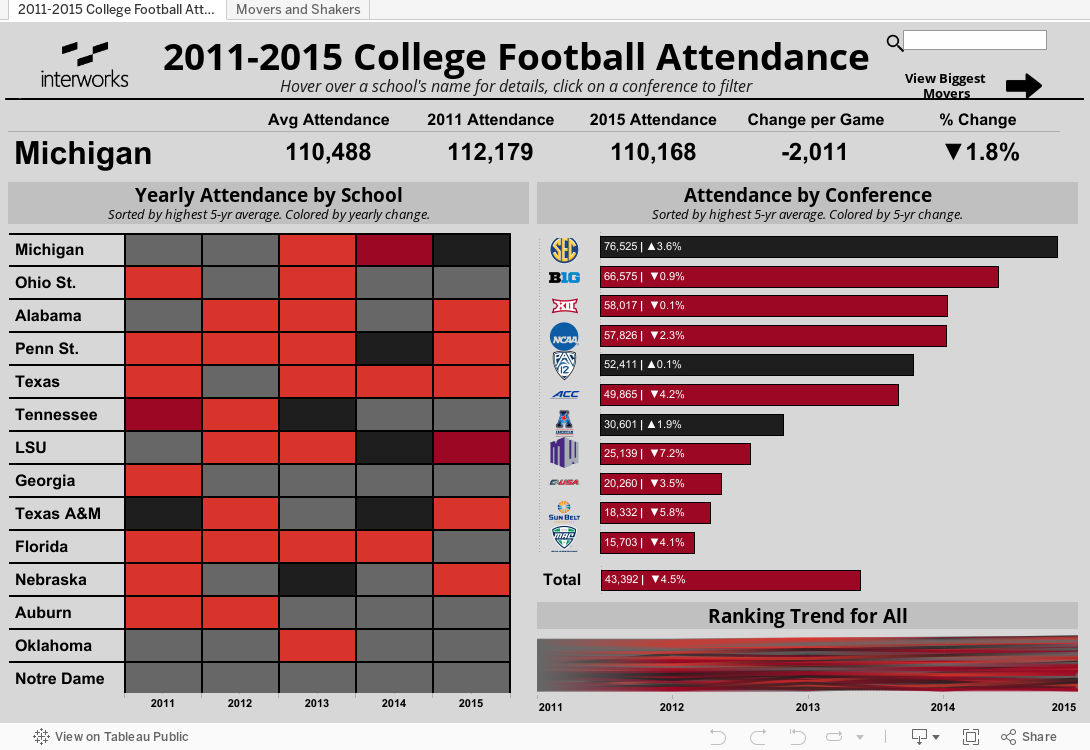
The data visualization below explains how much attendance has changed at each FBS-level program since 2011. The first dashboard shows a breakdown of programs and conferences, while the second dashboard provides a more detailed look into the Top 5 and Bottom 5 programs in overall attendance change.
Some of the key findings from the data include:
- The SEC, Pac-12 and American are the only conferences to experience an overall increase in attendance.
- The Mountain West Conference experienced the greatest decline by a single conference, with the average program experiencing a 7.2% decline in attendance.
- The biggest gain from an individual program occurred with Memphis, which saw in average attendance increase of 23,724 between 2011 and 2015.
- Texas A&M also experienced a big increase, which can mostly be attributed to its renovation and expansion of Kyle Field.
- On the other end of Texas A&M’s increase has been a sharp decline at rival Texas. The Longhorns have experienced a decline in average home game attendance of more than 10,000 fans per game.
- Most of the increases and declines can be attributed to on-field performance, although factors such as home game opponents, new coaches and new or renovated stadiums also played a significant role.
Check out the visualization below to discover how attendance has been trending at your favorite school: