
The latest version of Tableau has just been released, and honestly, 2019.3 feels like a major release rather than an in-year update. It is loaded with all types of goodies for Tableau Desktop, Server, Public, Prep and even Public.
There’s a lot to unpack here, so let’s start with a complete list:
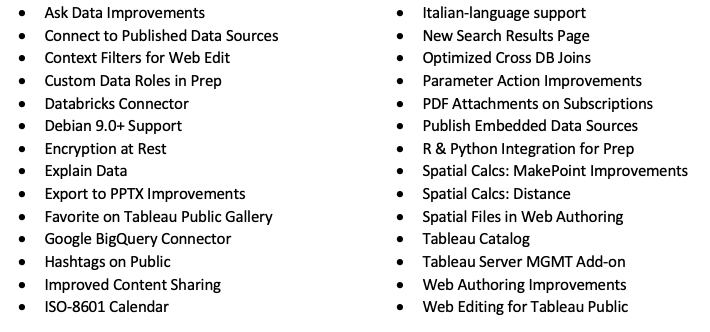
Wow! As we say in Australia, that’s choc a bloc, mate.
If I had to describe all of these new features in a few short terms, I’d say that Tableau is investing an incredible amount of their developer energies into making the toolset as automated and intelligent as possible. Tableau is trying to enable a broader swath of the business to do more with their data and analytics, largely driven by AI and automation around documentation.
Let’s get into five of the new features that I’m most excited about.
Spotlight on Explain Data
This is a BIG one. With no special preparation, add-ons or data preparation in the background, you can simply click on a mark in your view to get Tableau to explain why—why is that mark different than the others? Why is it unprofitable? Late? Too small? In the wrong place? Using Bayesian methods, Tableau quickly scans through hundreds of potential explanations until it finds one (or more!) that offers the best chance of explanation.
Here’s an example I created from scratch in under 20 seconds:
It’s available in all of your 2019.3 dashboards across Desktop, Server, Online and Public. Amazing!
Tableau Catalog
Governance is a massive priority for data-driven organizations. A self-service culture must be supported with effort by the Community of Practice to ensure that finding insights is easy and intuitive. Building a data dictionary is essential. Tableau has offered a massive helping hand in this effort.
Allow me to introduce the Tableau Catalog. As a part of the Data Management Add-on suite of features, the Tableau Catalog builds a complete view of how your organization is using data with Tableau, including lineage, metadata, usage metrics and impact analysis.
Learn more on the Tableau Catalog
Tableau Server Management Add-on
This particular feature hits quite close to home for the InterWorks family. Power Tools for Tableau Server and Deployment have now been reborn under the Tableau banner within the new Server Management Add-on. It’s with a lot of pride that we see a tool we worked on so diligently assume a new life here.
The Server Management Add-on is Google Analytics for your server environment and tracks outages, resource utilization, user engagement and much more beyond the standard suite of reports in Tableau Server. It is essential for enterprise-level management of your critical reporting system.
Learn more on the Tableau Server Management Add-on
Optimized Cross-Database Joins
Tableau Desktop has a lot of versatility in bringing together different tables and different data sources using joins and cross-database joins. The big drawback with joining in Tableau Desktop was that you were rolling the dice on performance.
Tableau 2019.3 offers a potential solution. You now have the option for Tableau to do the join in one of the data sources rather than inside the local Hyper data engine. You have this option when connecting a single file connection (Excel, PDF or text) to a single database connection (SQL, Oracle, PostgreSQL or Vertica).
Learn more on Optimized Cross-Database Joins
Ask Data Even More
Ask Data arrived in Tableau 2019.1 and introduced natural language processing (NLP) to Explorers, Interactors and Creators on Tableau Server. NLP is a great way for more and more users to find their answers in data without the need for any Tableau skills. Simply type in a query in natural language, and Tableau will produce the visualization.
In the latest release, Tableau has taken it to the next level by empowering Ask Data to be embedded into a corporate portal or wiki page to give even more of your team access to vital analytics.
Web Editing in Tableau Public
Yas! I personally love this. You can now use the web edit feature that was previously reserved for Tableau Server and Online within Tableau Public. I’ve published a few visualizations to my online gallery, and most of the time, I notice one or more little things that I want to change. In previous versions of Tableau, I had to go back to Tableau Desktop, re-open my dashboard, make the fix, save it, then republish the entire thing back out to Tableau Public.
Now, I can make those edits directly from the online interface with the web edit tool. Thank you, Tableau, thank you!
InterWorks Can Help
For all of your data and analytics needs, including an in-depth understanding of the Tableau platform, InterWorks can help. Whether you’re in Australia or across the seas in the United States or Europe, we’ve got a team of consultants near you. Let us know how we can help you on your data journey.