Tableau just announced the beta release of Tableau 10.3, and it’s clear that they have been listening to the worldwide Tableau community with the new features and enhancements. While a lot of the new stuff focuses on Tableau Server and Tableau Online, there are exciting features inside of Tableau Desktop that everyone will love from the start.
For this preview of Tableau 10.3, I’m going to focus on the Tooltip Selection feature.
Highlighting Data from the Tooltip
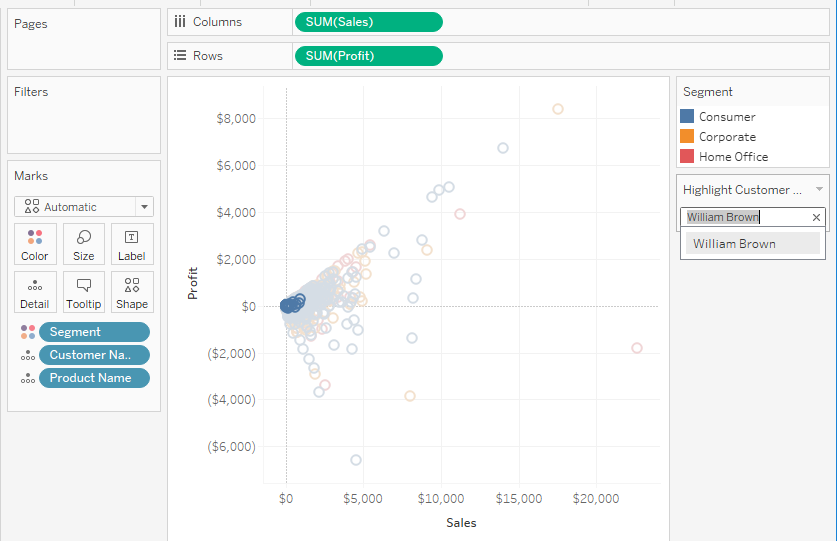
Prior to 10.0, you could only highlight your data using the color legend or a dashboard action. In 10, we saw the addition of the highlighter, another tool that lets you pick particular points of data to highlight. In other words, your report user can add emphasis to selected data by adjusting all other data down to approximately 25% transparency.

Above: Tableau 10.0: The Highlight Tool.
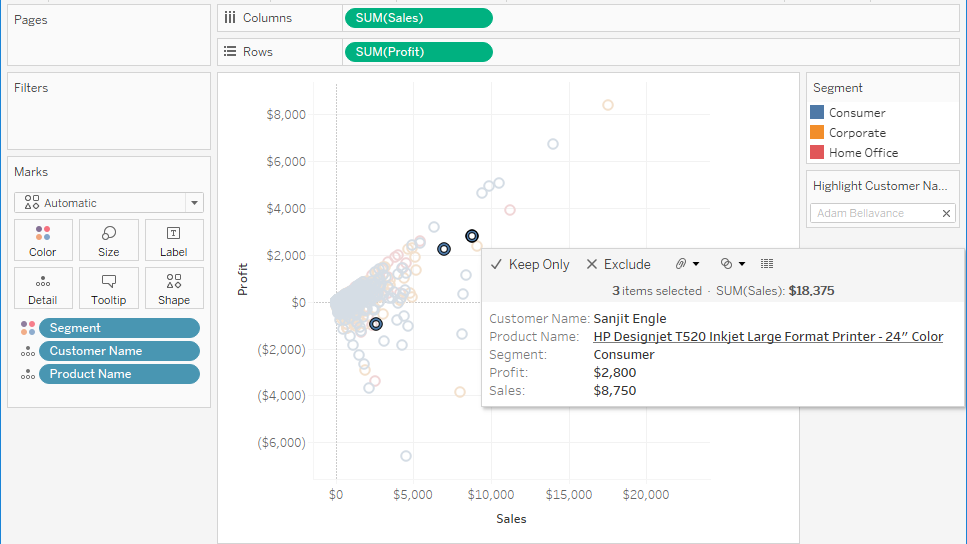
Now we get the ability to highlight all kinds of data by selecting it directly from the tooltip. As creators of the visualization, we don’t have to guess which dimension to put a highlight tool on to satisfy our user’s needs. Instead, they choose where the emphasis lies.
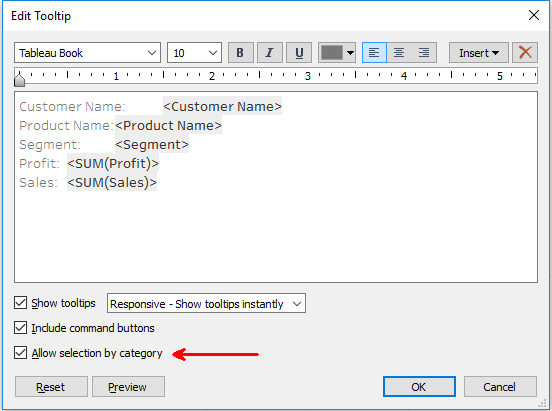
The Tooltip Selection feature can be toggled on or off from inside of the Edit Tooltip window.

Now if we click on a mark to fix our tooltip in place so it doesn’t disappear when we move our mouse cursor, we can select any of the dimensions inside of the tooltip as the equivalent of a Highlight Tool.

More from Tableau 10.3
There are a lot of cool things coming with Tableau 10.3, including new data connectors, more features for Tableau Online and Tableau Server. One of the biggest announcements is push technology for Server users to get alerts based on the thresholds defined in their published visualizations. Lots of great stuff.
Be sure to check back on the InterWorks blog for more previews on Tableau 10.3.

