
I love cars. The way they sound, the way the smell and the way they feel when you’re cruising down long roads. But sometimes, finding the right car for the experience can be troublesome. Car shopping is a lot like dating. There is a lot of fish in the sea, but when you find the right one, you’re in for the ride. I wanted to create the experience of shopping for a car with Tableau.
How It’s Built in Tableau
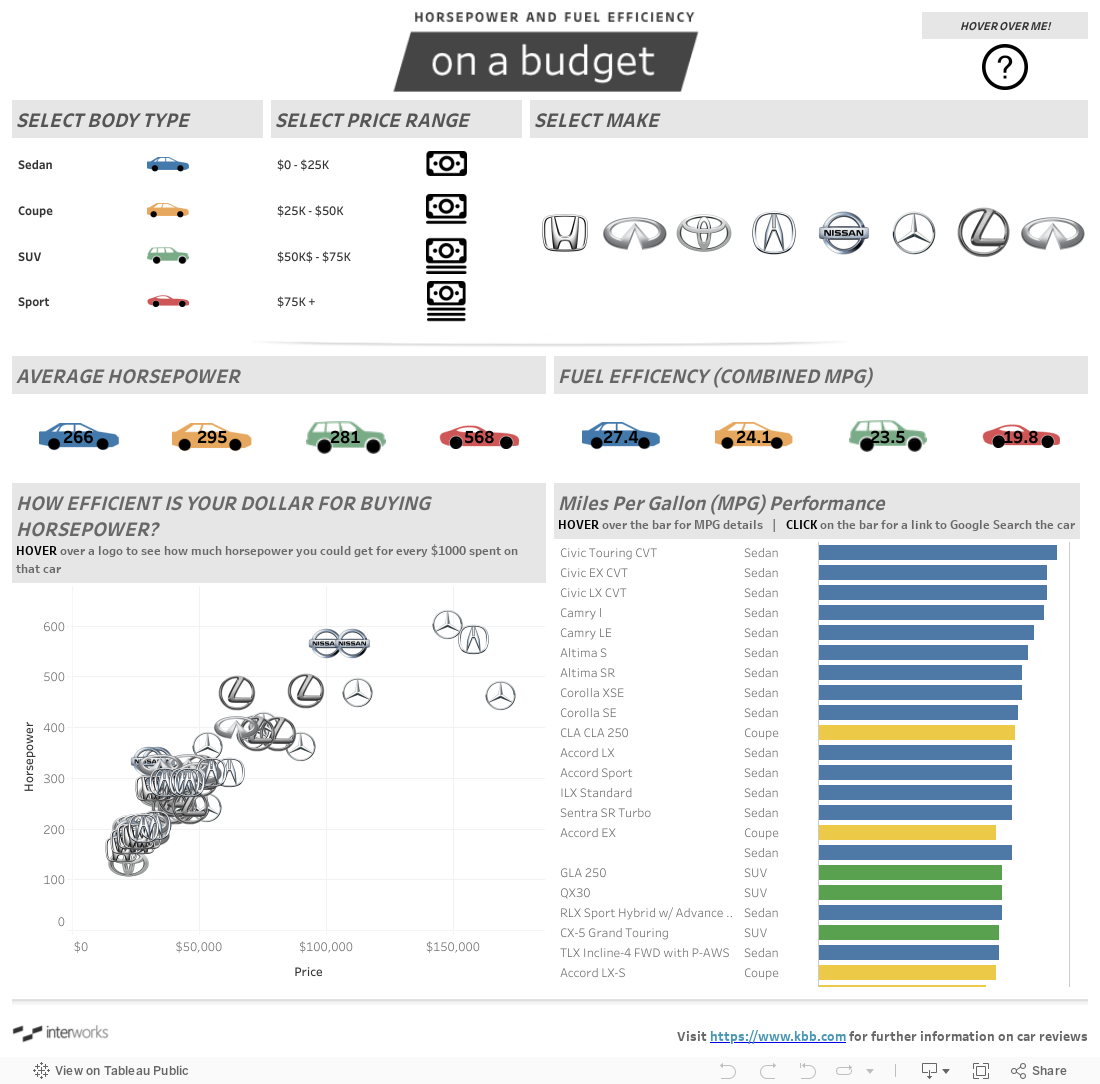
By collecting data from various car brand websites, I was able to compile a list of around 100 cars to compare in terms of both fuel efficiency, price and horsepower. I wanted to showcase Tableau’s ability to import custom shapes and using sheets in tooltips. They respectively add a personal touch and give your audience additional insights without cluttering up your dashboard.
For the shapes, I worked with our Experience Consultant, David Duncan, to create simple shapes that would easily register with anyone on the body type of a car and the cost range. I pulled PNG files of car logos from the web to represent each of the cars.
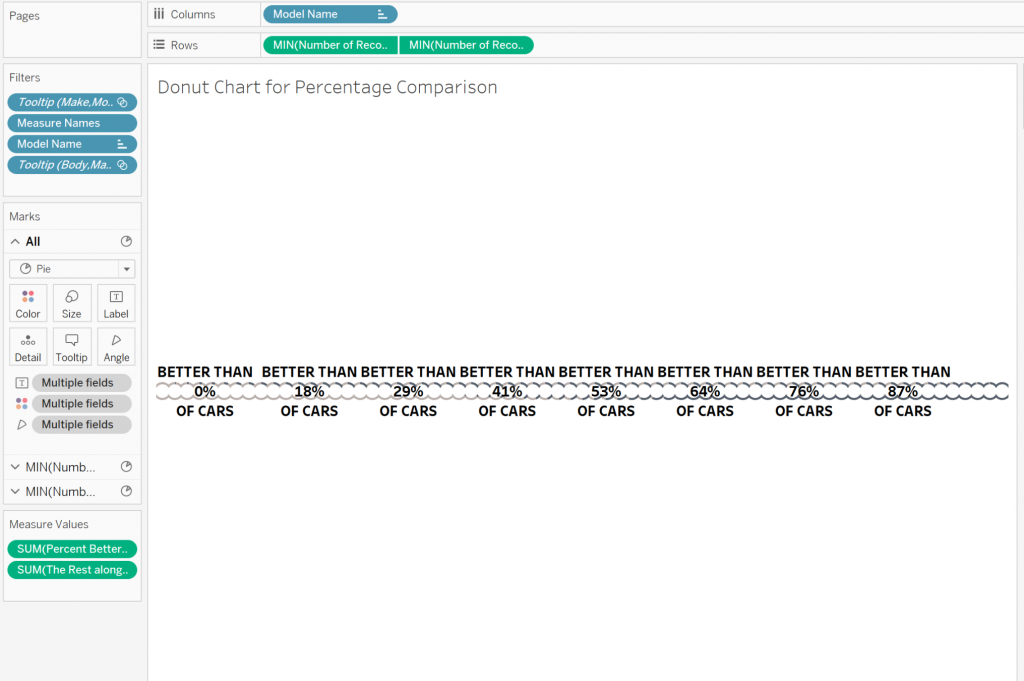
For the visualizations in tooltip, I wanted display the purchasing power of money in getting horsepower when purchasing a specific model. I’m a personal fan of the donut chart, so I set out to make it happen. Since sheets in tooltips get filtered based on the data that the user hovers over, I needed to create a worksheet that essentially had a donut chart for every single car.
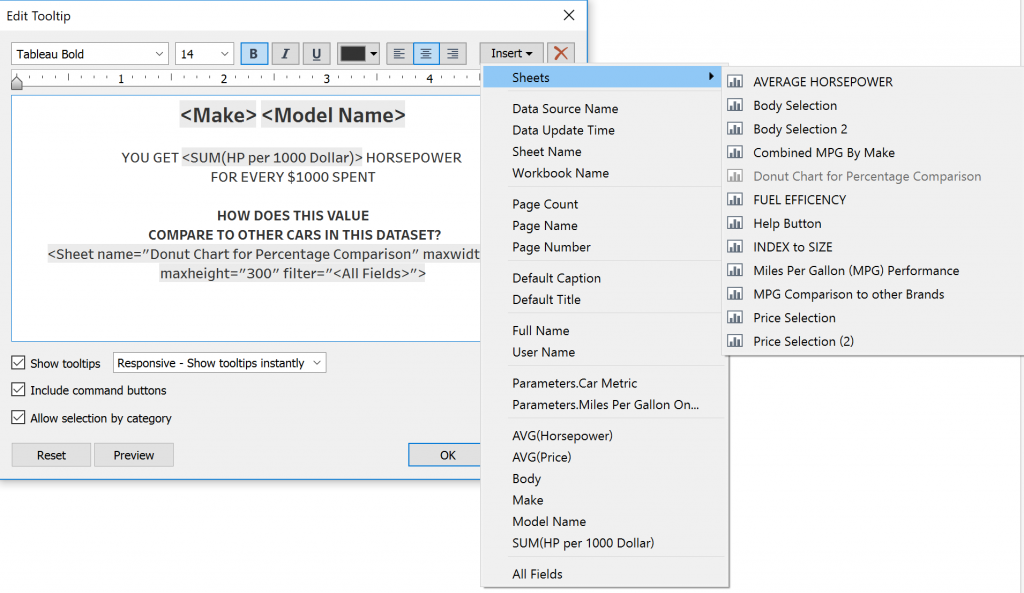
Afterward, I incorporated it into the scatterplot’s tooltip using the Insert option at the top-right of the dialog box.
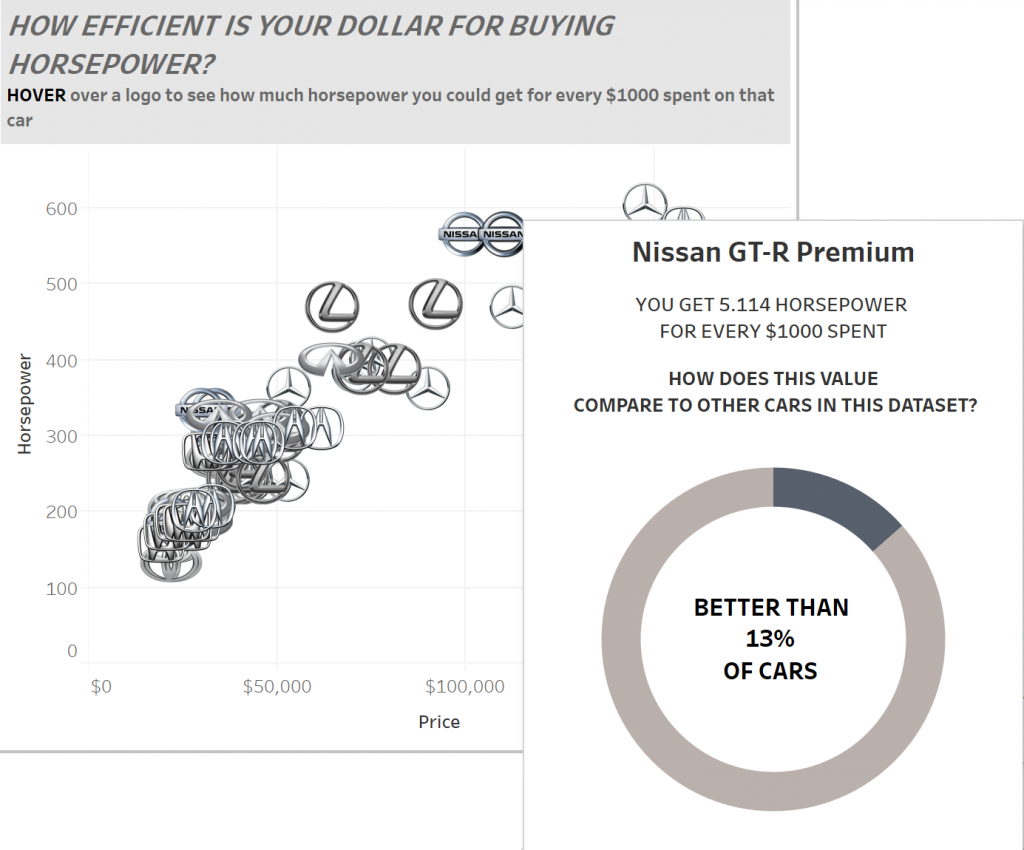
Now I was able to tell how much engine roar I was getting in my engine for every $1000 I spent. Unfortunately, money does not go directly to horsepower. Additional options drive up the price. That means the more expensive the car, the less horsepower you get per dollar.
While this does not factor in every detail of buying a car, such as safety, cost of ownership, resell value, etc., I do hope this has provided you with an interesting perspective on combining a love for cars and data. In the future, I plan on creating a more comprehensive dashboard incorporating those other factors.