
With the non-stop talk around NYC about “Hamilton,” I figured it’s about time to look into some Broadway data. As someone who is not well versed in the theater community as a whole, it’s been interesting to see many people (myself included) become so enamored by Lin-Manuel Miranda’s pivotal work.
My initial thought was to look into the effect of the show’s popularity on Broadway as a whole, so I wanted to take a look at how attendance has changed for major Broadway productions over the years. I pulled data going back to 1987 from Playbill.com using import.io, then I used Alteryx to prep my data for Tableau.
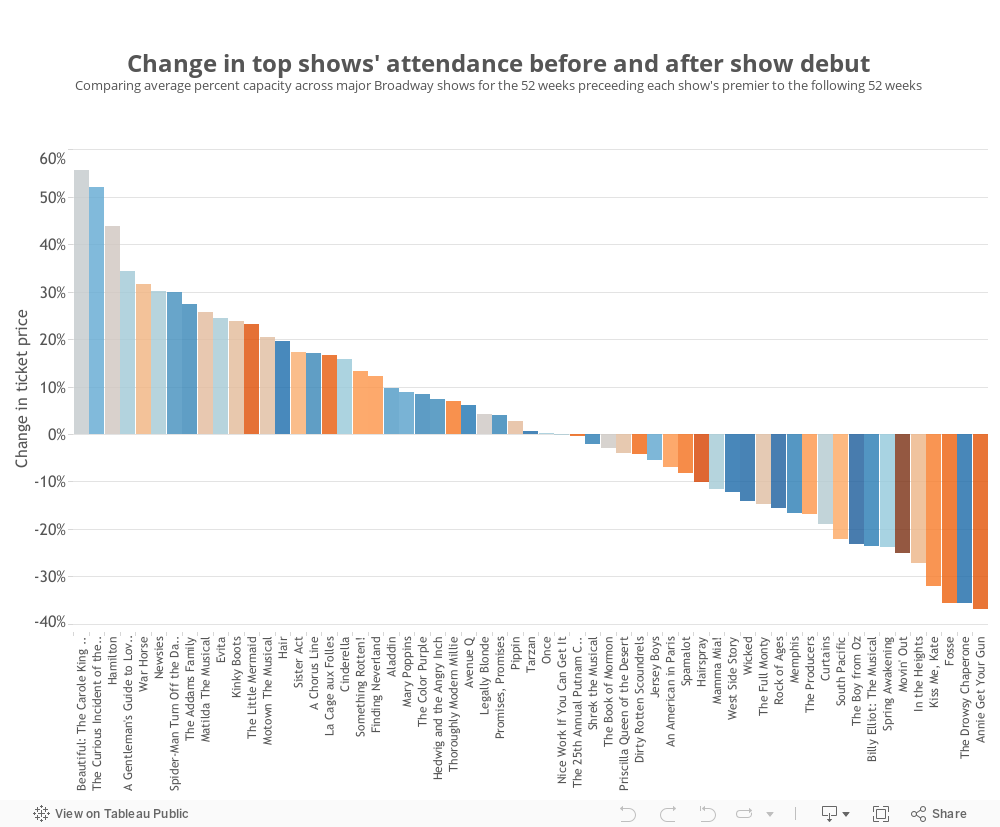
Due to some data quality and availability issues, I went with a bit of a blunt approach to my question, comparing the average cost for a ticket to one of the top 100 shows for the 52 weeks before each show premiered to values for the same time period after the show’s premier. I’ll touch on the issues with this approach further down, but for now let’s take a look at what this approach may suggest.
Things to Consider
You can see the average ticket price rise up here after Hamilton’s debut, though not quite so much as another classic show with its own fair share of mass appeal in “Beautiful: The Carole King Musical.” Unfortunately, while this is quite a compelling story, there are a number of issues of taking this simplistic approach.
One of the largest of these is seen by looking at production between Carole King and Hamilton – “The Curious Incident of the Dog in the Night-Time.” Another extremely successful show that debuted a bit less than a year before Hamilton is going to skew the baseline for the analysis.
We know this is not the only instance of this issue – using such a wide window of data may increase the sample size and account for seasonality to a certain degree, but it does so at the cost of a stable control sample for our analysis. Still, while the results certainly point to an interesting story, further research is needed for me to be satisfied with the conclusion.
Trying a New Tableau 10 Feature
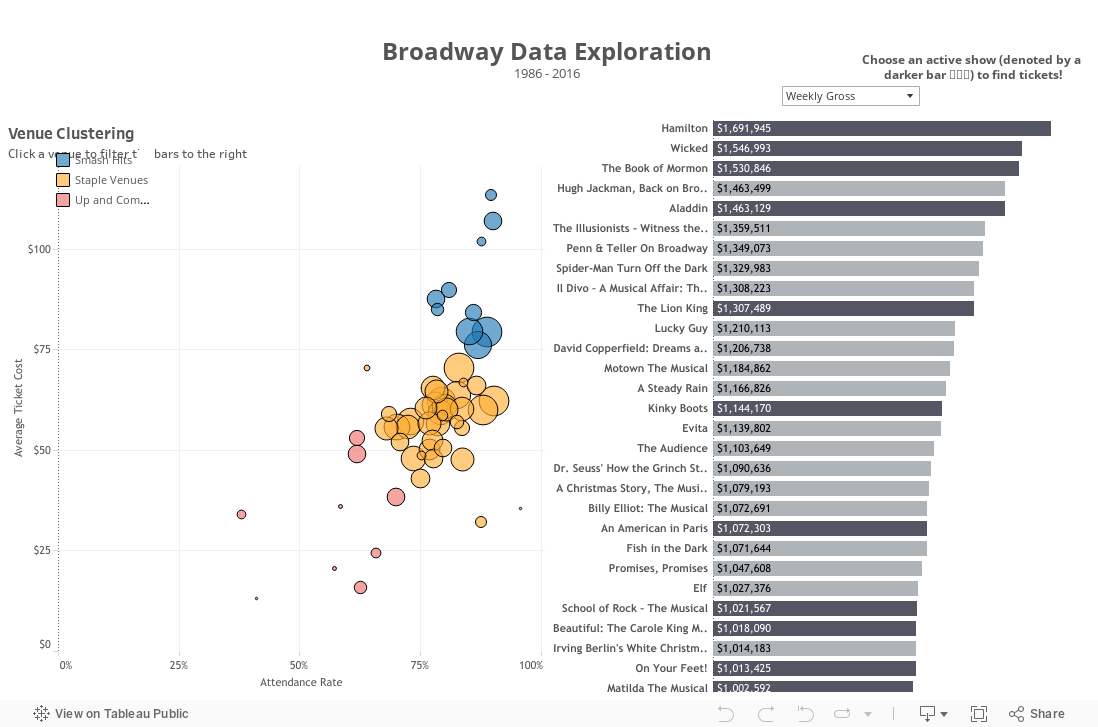
While I had the data set in my hands, I also wanted to try out one of the new features on the (not yet released) Tableau 10. Starting with a scatterplot comparing venues based on average ticket price and attendance rate, I then created clusters of venues based on these same factors.
Tableau naturally sorted them into three groups which I then called Smash Hits, Staple Venues, and Up and Comers. I exported these groups back to Tableau 9 so I could publish to Tableau Public, then I built the following dashboard to take a closer look at the different venues and shows. Try clicking a venue on the scatterplot to see what shows have been performed there to the right. You can also choose what metric is being shown by the bar chart of shows.
Surprising Results
Again, this may betray me as a theater novice, but I was blown away by the Total Gross for shows like “Lion King” and “Phantom of the Opera.” I also found that Hamilton is the top show when looking at Weekly Gross, though is it difficult to compare the show in its heyday to such long time staples as “Wicked” (debuted 13 years ago) or even the “Book of Mormon” (five years ago). At this point, we’ll have to reserve judgment on Hamilton’s place in Broadway history until we see how it’s success is sustained. In the meantime, I’ll need to find a way to see it myself. Hopefully I don’t have to wait for it too much longer!