Are you an avid cyclist who regularly uses Strava to track segments and claim K/QOM? Are you a data fiend that yearns to analyze and manipulate fitness tracker data in Alteryx for visualization in Tableau? Well, now you can! In this two-part series, I’ll detail the process I used in analyzing my recent OK Freewheel journey.
Step 1: Export GPX Files
To begin, export your data into GPX files by referencing this article from Strava. To keep things modular, I chose to export each segment individually for bulk processing in Alteryx:

Step 2: Get Turnt Up!
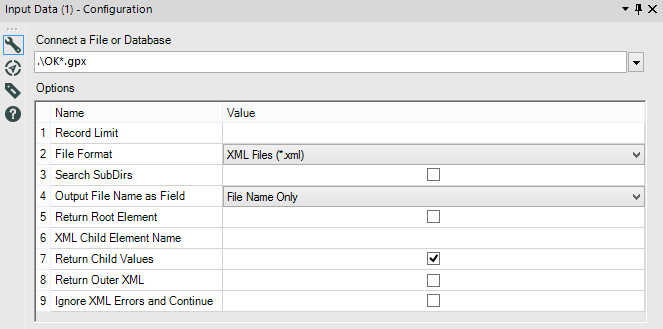
Fire up Alteryx and point an INPUT DATA tool to your GPX files by using a wildcard search. In this case, I used .OK*.gpx and specified XML as the file format. I also chose to include file names as a field to keep everything organized:

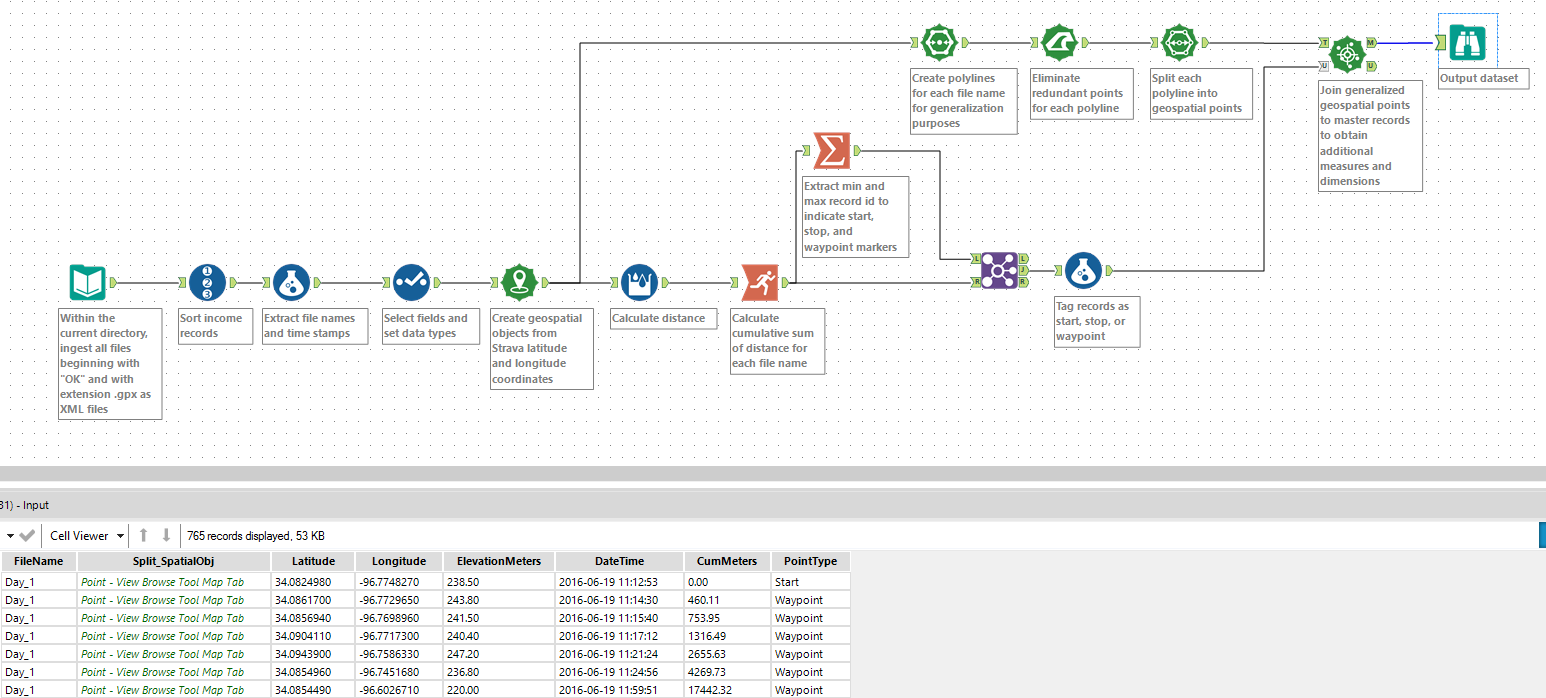
What you’ll get is a table containing latitude / longitude coordinates, elevation (meters), date, time and file name:


