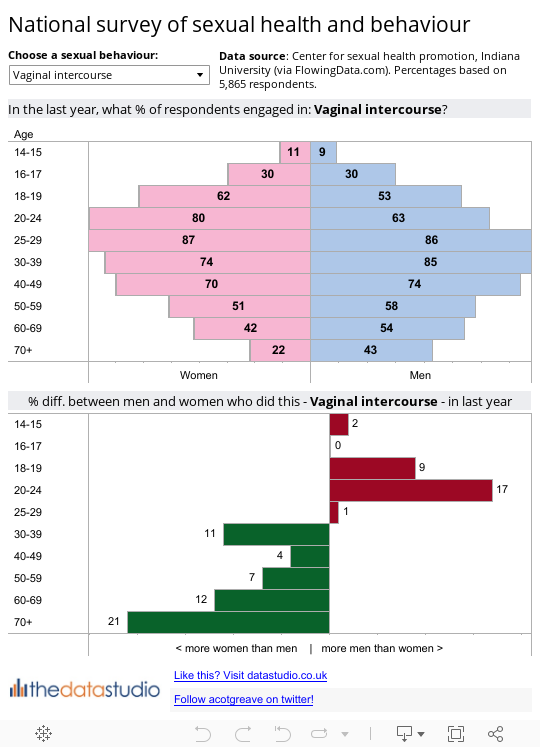
Flowing Data laid down the challenge to visual the sexual health and behaviour dataset from Indiana University. Seemed like an interesting topic…. Here’s my attempt:
Flowing Data laid down the challenge to visual the sexual health and behaviour dataset from Indiana University. Seemed like an interesting topic…. Here’s my attempt:
Interworks GmbH
Ratinger Straße 9
40213 Düsseldorf
Germany
Geschäftsführer: Mel Stephenson
Kontaktaufnahme: markus@interworks.eu
Telefon: +49 (0)211 5408 5301
Amtsgericht Düsseldorf HRB 79752
UstldNr: DE 313 353 072