

Above: Princeton’s Heather Campbell presenting at TC15.
We did a lot of fun things at Tableau Conference 2015, but one of our favorites was presenting a session with our friends over at Princeton University. InterWorks’ Kate Treadwell took the stage with Princeton’s Director of Analytics & Data Management, Heather Campbell, to share a few tips on how to go from working in crosstabs to running an ideal analytics practice. The session is entitled “Everyone Wants a Crosstab,” and you can view it by first logging into Tableau’s virtual conference site and then navigating to this link.
Session Synopsis
Building a Team
The session starts off with Kate outlining the essential components of an effective analytics practice centered on Tableau. She began by explaining the importance of building and training the right team. This begins by understanding which tools and practices are most effective to help such a team become more proficient with their data. Kate went on to explain that things like best practice guidelines, office hours and the implementation of an internal wiki can be invaluable educational resources and speed up Tableau adoption.
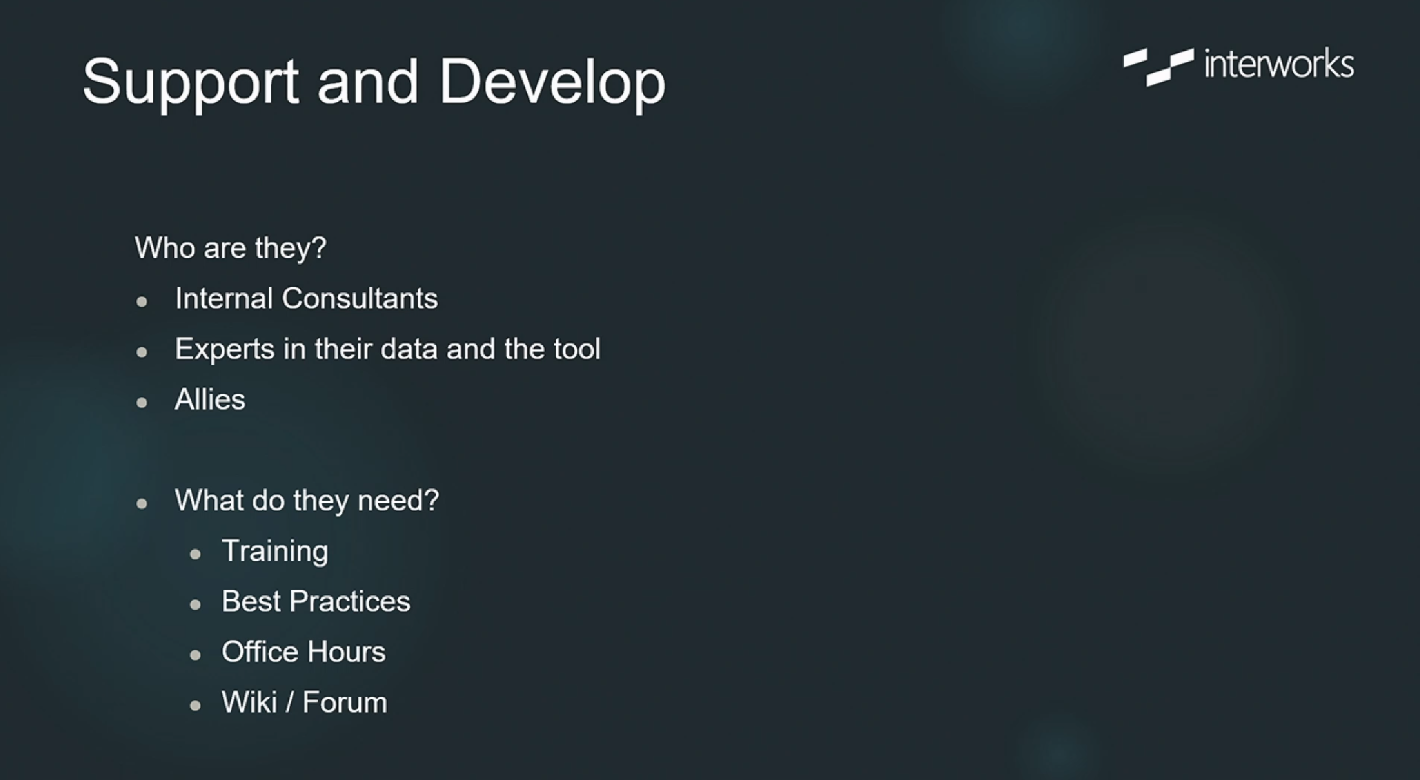
Above: Potential support and training resources.
The Data
Next, Kate explained the importance of getting data in order. By forging stronger relationships with DBAs and IT, analysis becomes much easier. Another big topic discussed was data governance. She described Tableau Server as an invaluable tool for administrators in keeping sensitive information found in dashboards in the right hands. By using Tableau Server’s extensive permissions options and outlining some promotion guidelines, IT can better manage data governance efforts.
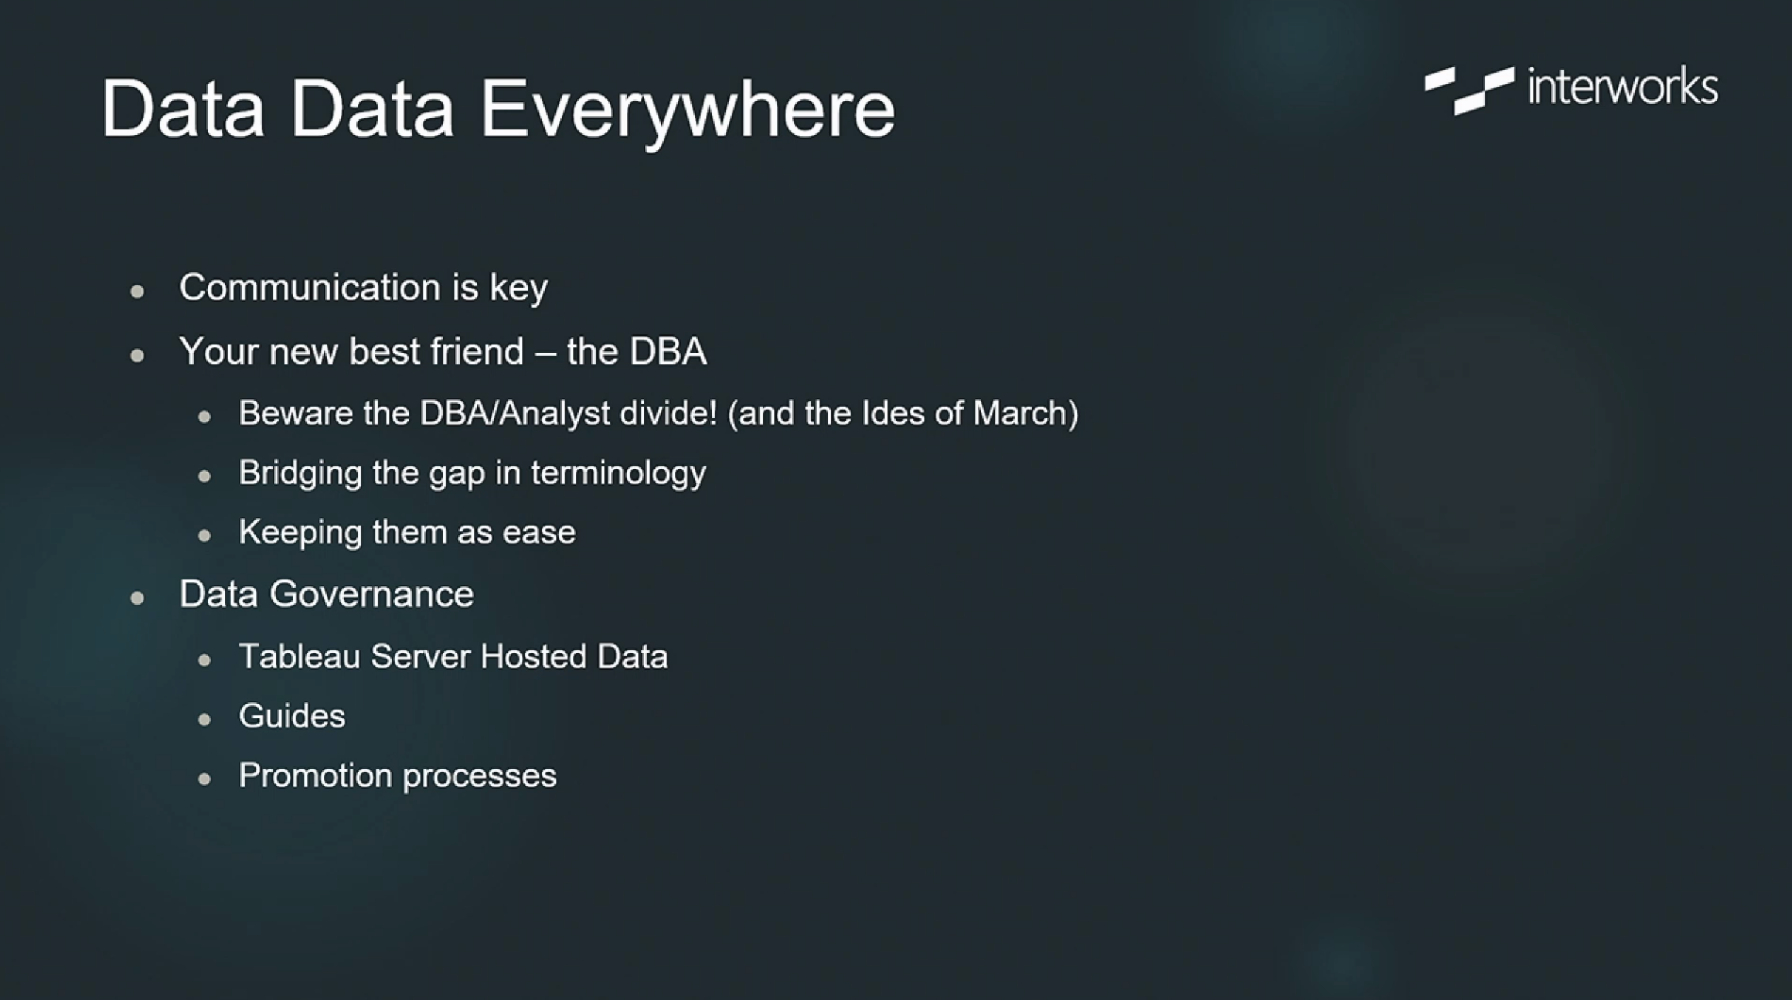
Above: Bridging the divide and data governance tips.
Using a Tableau Portal
Finally, to tie everything together in the ultimate adoption/governance package, Kate gave a quick demo of Tableau portal built by InterWorks. Such a portal allows users faster access to relevant data and even gives them the option to download more streamlined crosstabs if they so desire. They can also find dashboards of interest to them and interact with those dashboards within the portal. On the governance side, a Tableau portal allows IT and administrators even more control.
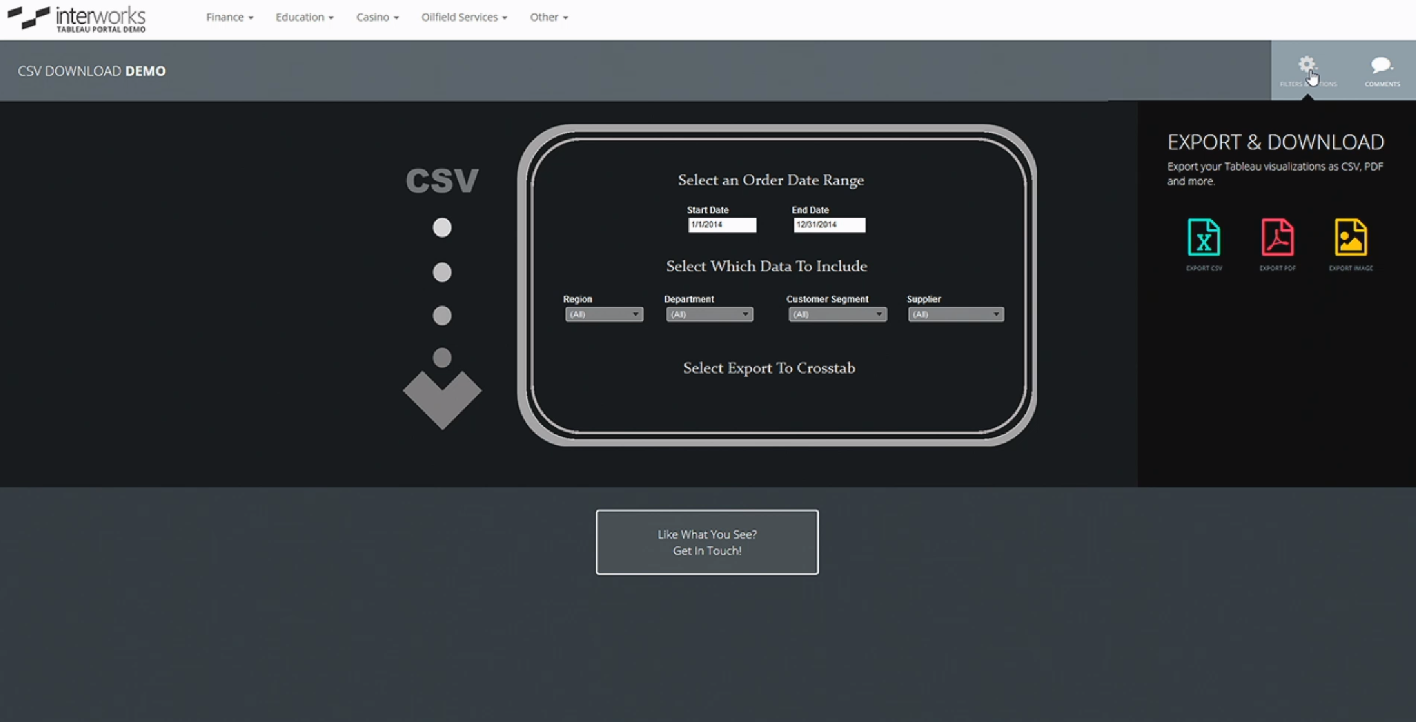
Above: CSV download functionality in an InterWorks Tableau portal.
Princeton’s Journey
Next, Heather took the stage to share how Princeton followed these guideline to take their analytic practice from using crosstabs to sharp and intelligent Tableau dashboards. She began by explaining her role as well as the role of her team in Princeton’s Fundraising Office. She outlined what was included in their standard crosstabs and how they used to use them. She went on to explain how acquiring Tableau led to a noticeable shift in how they interacted with their data. Princeton’s analysts essentially had to retrain their brains to think in terms of Tableau as opposed to static crosstabs.
This shift caused Princeton to really focus on understanding their end users better. By segmenting them and discovering what they really wanted out of their data, they were able to build truly useful dashboards. Heather shared several dashboard examples created by her team and how these new dashboards have allowed them a better understanding of their fundraising and stewardship efforts. By using a dedicated Tableau Server for external users and their own Tableau portal, Princeton also improved governance across the board. They can now share portions of their CRM securely with user-level permissions in place.
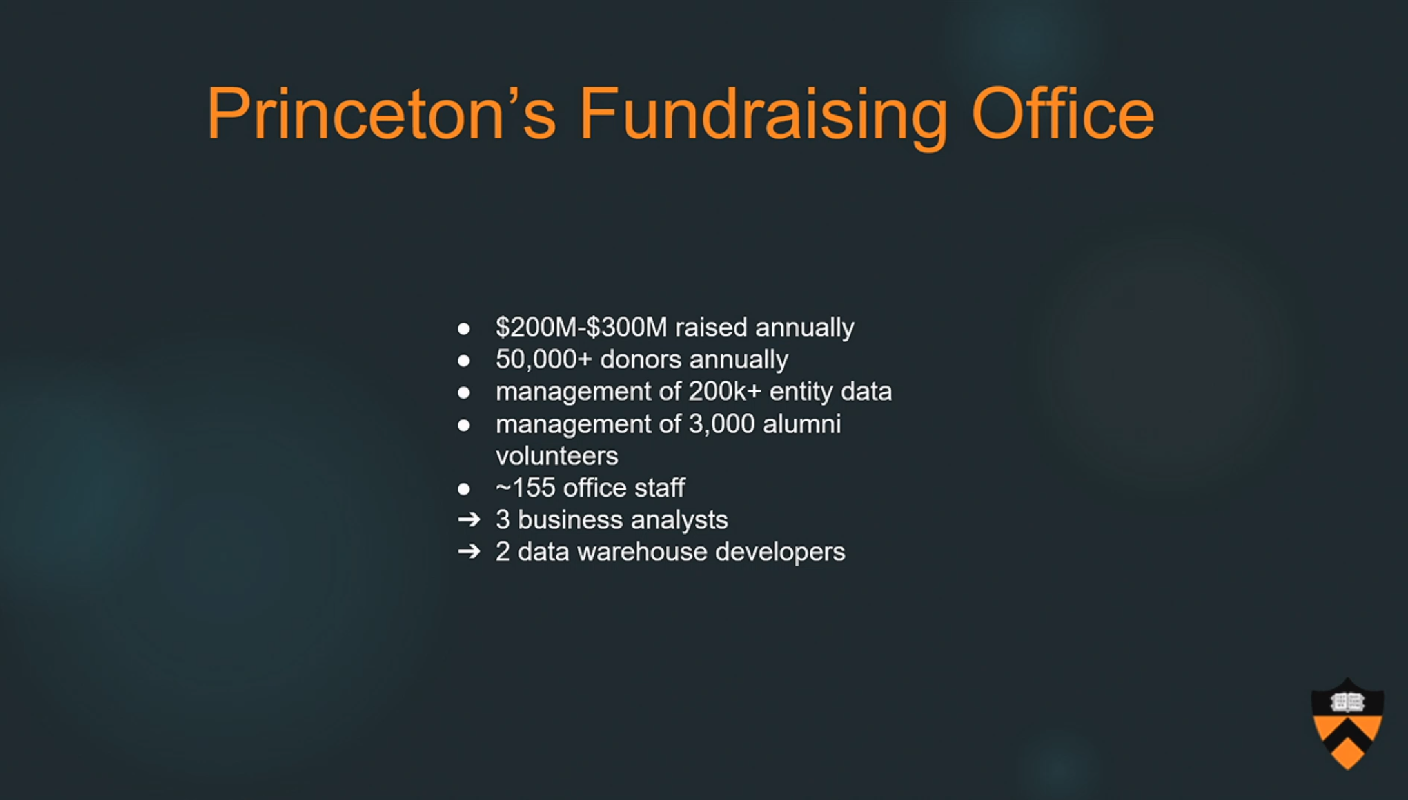
Above: Stats about Princeton’s Fundraising Office.
Tableau Help from InterWorks
At this point, Heather gave a big shout out to InterWorks for providing crucial Tableau training and architecture assistance. She explained how this training was a real investment and helped them to bridge the gap between end users and IT. By understanding both sides (what she called “data empathy”) and helping them start conversations between the different groups, Princeton was able to build a solution that met everyone’s requirements. From acquisition to analysis, these efforts allowed them complete control of their data from end to end. She also shared some dashboards that included email marketing data blended with giving data, which served as an example of this new level of mastery.

Above: An example Tableau dashboard from Princeton.
Princeton Now
Heather wrapped up the presentation by saying that Princeton has now implemented Tableau across all functional areas. With all the right pieces in place, Princeton is experiencing a groundswell, and peer-to-peer conversations are taking over. In summary, adoption is increasing and their dependence on crosstabs is decreasing, which was the goal all along.