We are back with the next installment of InterWorks’ Quantified Office, thanks to another tasty delivery from Tracy. This time, she gifted us with five wonderful brands of chocolate coconut cookies, known to many as Samoas. Willing to bear the burden of finding the best cookies around, we decided to engage in another blind taste test.
The rules from our Thin Mint taste test remained the same:
- No one would know the brand of the cookie.
- Everyone would close their eyes while eating so as to not be influenced by other people’s reactions.
- Pinky promise.
I personally oversaw the random assignment of cookie brands as a neutral third party; I did not participate because I am #ThinMintsTilIDie
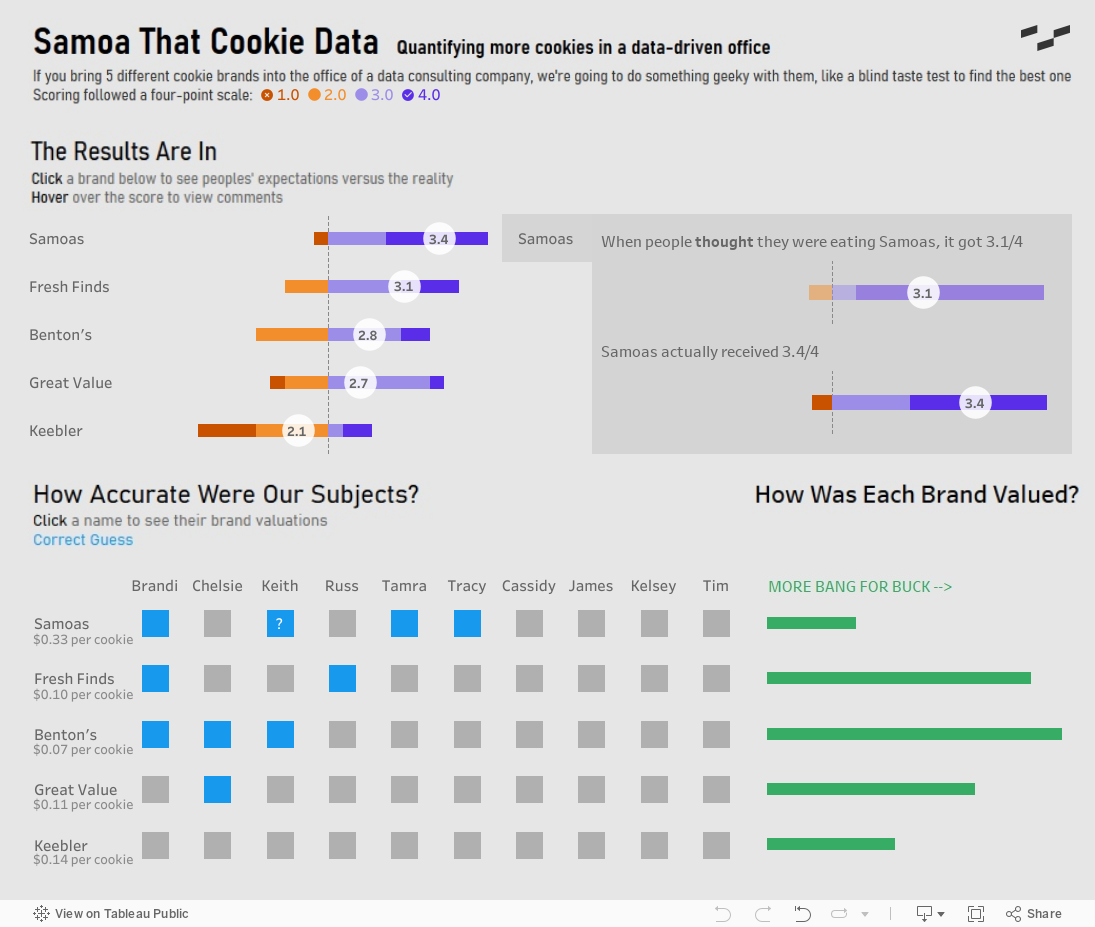
The main point of the dashboard is, of course, the ratings assigned to the cookies. For this data, I decided to look into different methods used for displaying survey data and settled on a Likert Scale view on a diverging stacked bar; you can learn how to build a Likert Scale view from many different YouTube videos.
Is the Brand Worth the Buck?
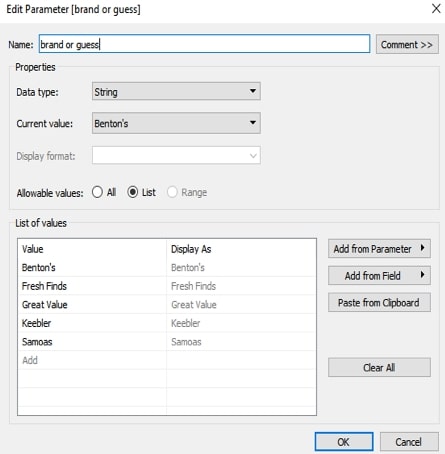
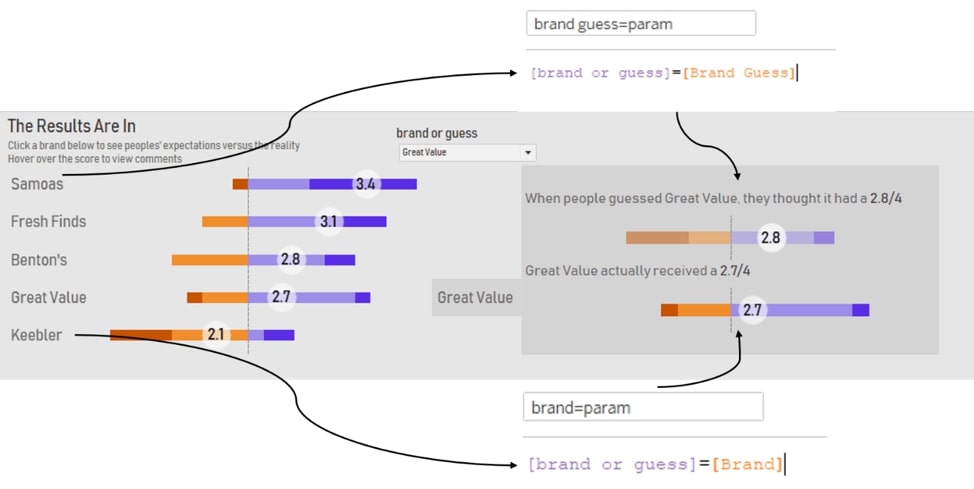
One of the unique facets of our setup was that we had InterWorkers also guess which brand they thought each cookie was. This means that we can compare what people thought each brand was worth vs. its actual worth. In the dashboard, I accomplished this with a pop-out view driven by a parameter action. The parameter in this case was a list of the different brands, and the action resulted in a calculated field evaluating whether the parameter matched a brand or a brand guess in the respective views. If you did not want to read that, here are some pictures:
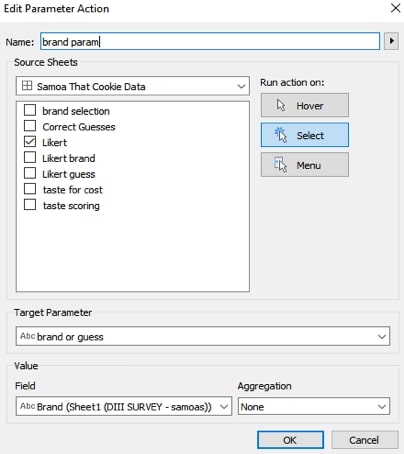
I also used a couple Viz in Tooltips—one in the score bubble in the Likert Scale and one in the guesses chart in the bottom-right corner—to give some additional detail without overpopulating the dashboard. These are great for saving space and/or giving additional context to views already on your dashboard. Remember, if you use a Viz in Tooltip, keep it simple. Tableau is filtering the embedded view each time, so the more complicated it is, the more lag you will get when hovering over your views.
Go ahead and check out the view below. Reach out if you have any questions!