
If you have ever been in one of my Tableau training courses, you have probably heard me refer to Tableau’s format pane as “the Bermuda Triangle of Tableau” because it can be easy to get lost. What is great about the format pane is that it offers a plethora of options relating to how our viz looks, but it can be a lot to take in! In this post, we are going to break it down section by section, so you can stop hunting and pecking like a kid in his first piano lesson and start becoming the maestro of formatting within Tableau.
First off: How do we get there?
Navigating to the Format Pane
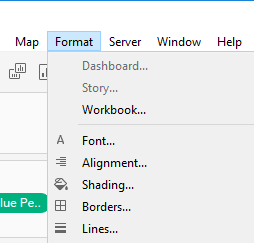
The most surefire way of getting to the format pane is from the Format drop-down menu at the top of your Tableau window. In the second area of that drop-down menu are options to navigate to the different tabs of the Format pane. Here is how these options are displayed in the Format drop-down and in the pane itself:
We have three tabs in each of the different Format pane areas: Sheet, Rows and Columns. Sheet will dictate the formatting across the entire sheet, while Rows and Columns will only format elements specific to either Rows or Columns. This sounds simple enough, but let’s take a look at what we mean here.
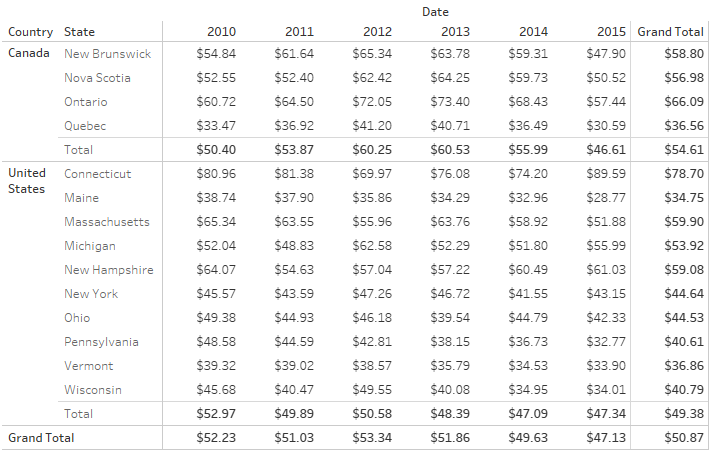
Everything in blue is a result of changes made from Columns, and everything in orange results from changes in Rows:
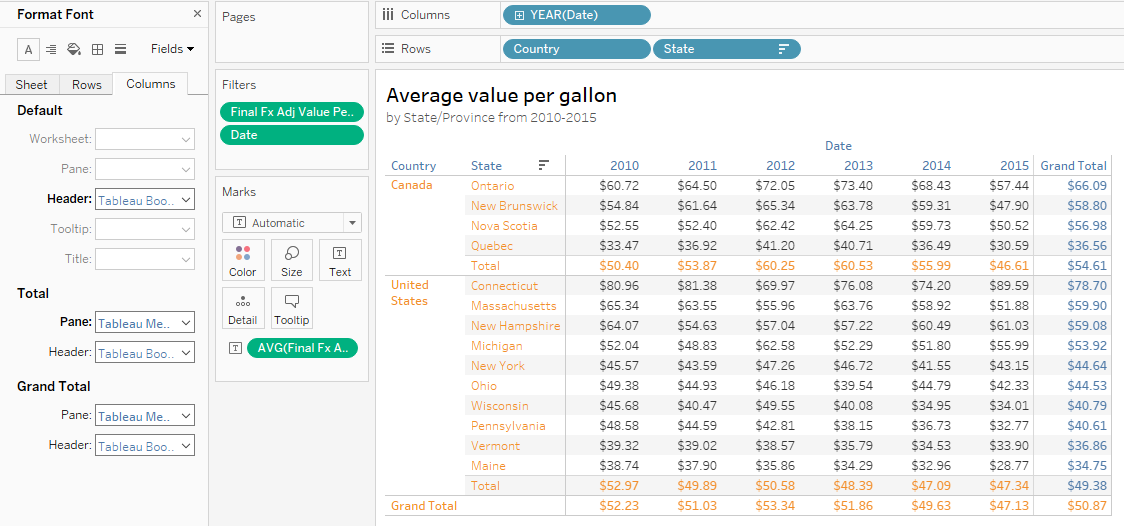
My different countries and states are creating rows while Column Grand Totals and my Subtotals are also giving me additional rows of values, which is a little counter-intuitive, but you can see when we add values down each column that we are creating another row. My headers for Country, State, Row Grand Totals and years are affected by the Columns tab in the Format pane because they are parsing out each column in my crosstab.
Now, let’s look at the different options available to us within each tab.
Options Available in the Format Pane
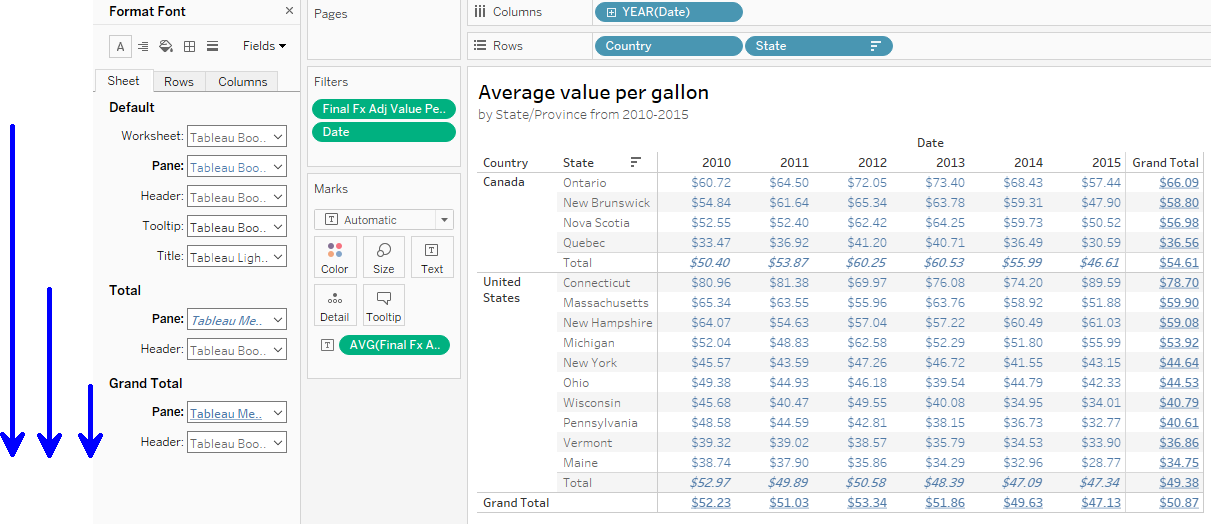
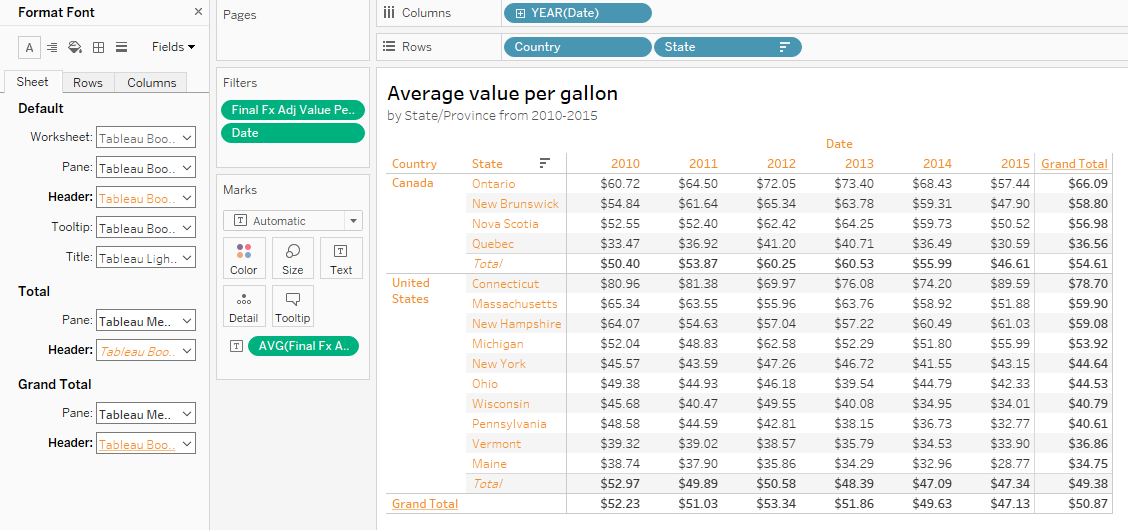
Worksheet controls everything in our view except the Title and Tooltip. Pane and Header are subsets of Worksheet that deal with either the values in our view or the headers on the perimeter of our view, respectively; these will override our selections from Worksheet. These selections will cascade down into the Total and Grand Total areas (see the graphic below), but they can be overridden from those areas.
Here, I selected blue text from Default Pane, which turned all of the values in the view blue, but then I selected italics for Totals and underlined for Grand Totals, overriding the Default Pane selections in those areas:
Here is the same process done for the Headers:
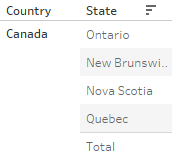
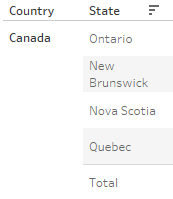
All the concepts discussed in this section will apply equally to the alignment area. One point to add relating to alignment is that text wrapping is still dependent on the size of the cell. Below, my cell is still too short to fit a second row of a province’s name, but if I make it a little taller, the text wrapping can take effect:
Shading
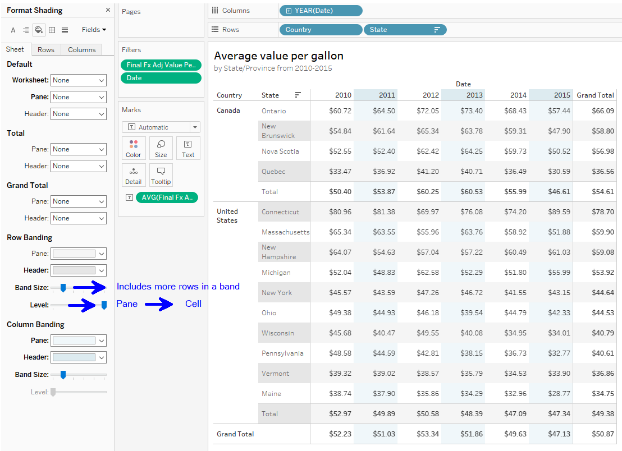
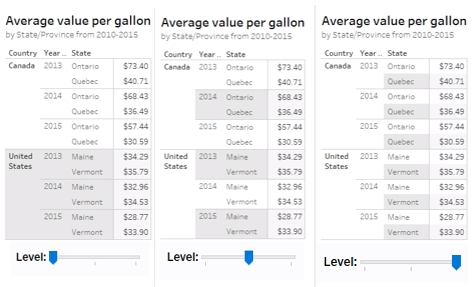
Shading can be an interesting area within the Format pane. The same concepts apply when it comes to the concept of cascading formatting from the Default area to the areas for Total and Grand Total. In the shading area, we also have options for Row and Column Banding. We can select different colors for the Pane (our values) and the Header. We can also affect how many rows or columns are included in a single band through the Band Size slider. Level refers to the scope of what we are including in our band and relates to the dimensions we have splitting up our view (see the second graphic here for a better representation); this ranges from the cell level to higher Pane levels:
Borders
Borders are the lines that divide up our dimension members in a view. The concept of Level is relevant with formatting borders as well. In many ways, borders are an alternative to shading in terms of organizing a crosstab view and operate very similarly. Selections in the Row and Column dividers will override the earlier sections in this pane. Row and Column dividers are also applicable to non-crosstab views; Pane selections provide a border around the edges of the view, while Header selections will move the border into the header or axis area if applied at the right level.
Lines
Lines come into play when we have an axis in Tableau, so think of a bar chart or scatterplot:
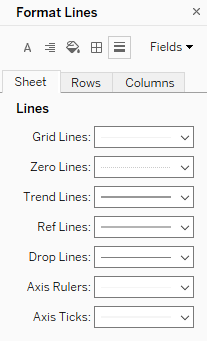
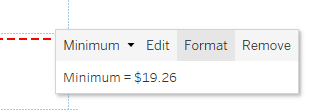
We have the same options available to us in each of the tabs within Lines. Grid Lines control the lines for values along our axis or axes—these are place markers that extend our Axis Ticks. Zero Lines are (as their name suggests) lines at the value of zero, where your X and Y axes originate. Trend Lines affect our view only if we have a trend line available to format. Ref Lines operate the same way with the reference lines in our view, but there is a caveat here: the formatting done in the Format pane only takes place if we have not edited the line’s appearance in the Edit Reference Line menu or Format Reference Line pane (see below):
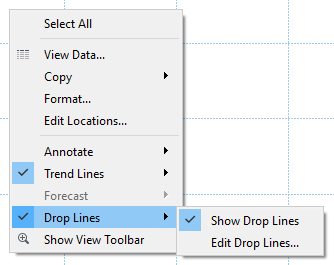
Drop Lines can be added by right-clicking in the view and selecting Drop Lines > Show Drop Lines. These can be used to visually pinpoint the exact values on the X and Y axes for a selected point. We can edit these here as well:
Axis Rulers affect the axis line that runs along the perimeter of our view, while Axis Ticks affect the tick marks at each labeled value along the Axis Ruler.
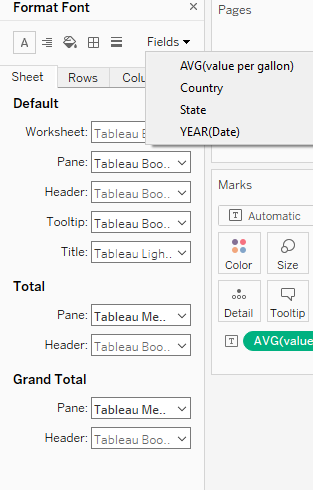
Formatting Individual Fields
You may have noticed a final option at the top of the Format pane, Fields. This allows us to format isolated fields instead of our typical Worksheet, Pane and Header options. Sometimes our fields will line up with the typical formatting options mentioned above; Pane references the values in the view, which in this case lines up with AVG(value per gallon), but Header is comprised of Country, State and YEAR(Date) in different locations, so formatting the individual fields here allows for more flexibility:
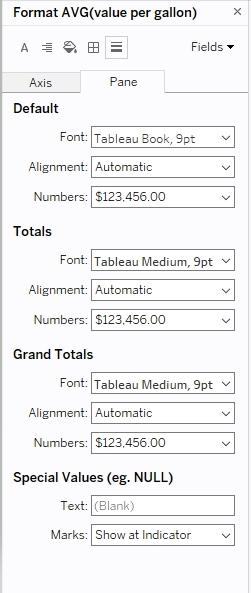
The options available in the fields’ formatting options will be restricted depending on how the field is being used and the layout of our viz. For example, here are the options for AVG(value per gallon) when I have the table above:
And here are the options when I bring another measure into the view as well:
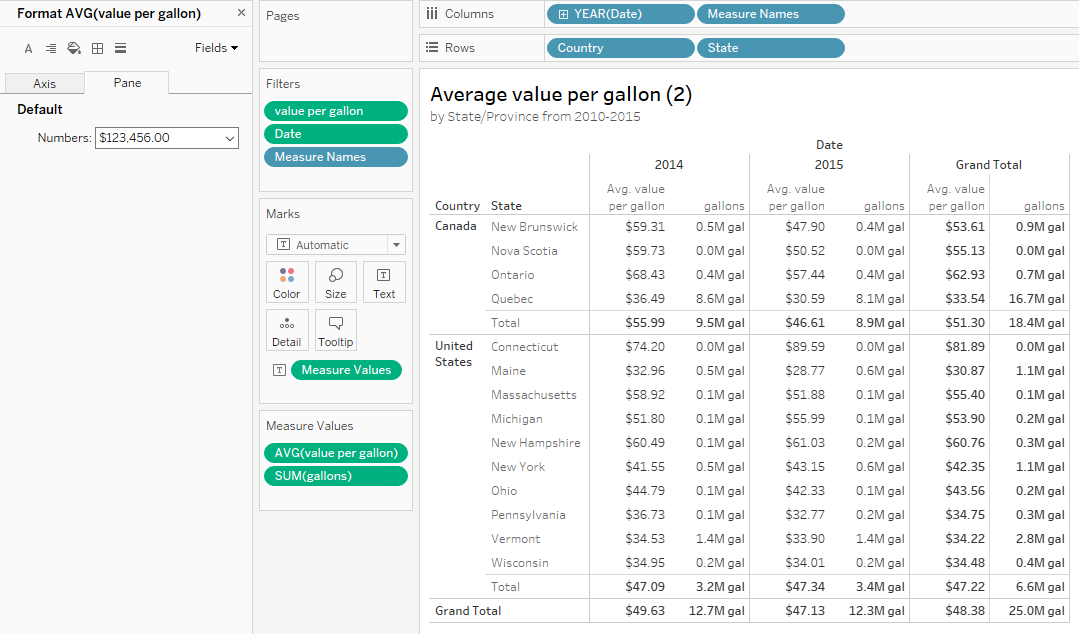
If we want the options we had in the former example, we would now need to select Measure Values as our field.
Conclusion
In this blog, we looked at all of the different areas of the Format pane. Even with our dive into the nooks and crannies of the Format pane, there will still be moments when you are unsure of what selection needs to be made. Trial and error is still an acceptable method while you are learning how to format things in Tableau. In those cases, the “when in doubt, right-click the thing you want to format” method can also be helpful in getting you the formatting menu that will be the most helpful.
Guessing will happen, mistakes will be made, and that is okay! There is always the Clear button at the bottom of the pane to restore the formatting to the default:
Hope this was helpful!