
The keynote presentations at Tableau Conference are always exciting. It’s always nice to hear these data all-stars unveil the latest and greatest in Tableau technology.
The first keynote was all about building a data culture. Hearing from the CEOs of both Tableau and Salesforce was a real treat. They even had a few features demonstrated by Tableau product managers. My favorite was the ability to write to database in Tableau Prep, which is coming out next year. However, Devs on Stage is my favorite keynote every TC. This blog is a summary of the features shown in this year’s presentation and what you can expect in future Tableau iterations.
Animated Analytics
Victoria Wagner, a software engineer with Tableau (who apparently drinks a lot of tea) started things off on a high note with Mark Animations, which is coming to Tableau next year. Changing filters allows you to follow and see changes on your data. This brings the play for pages to the web and will be available on any server:
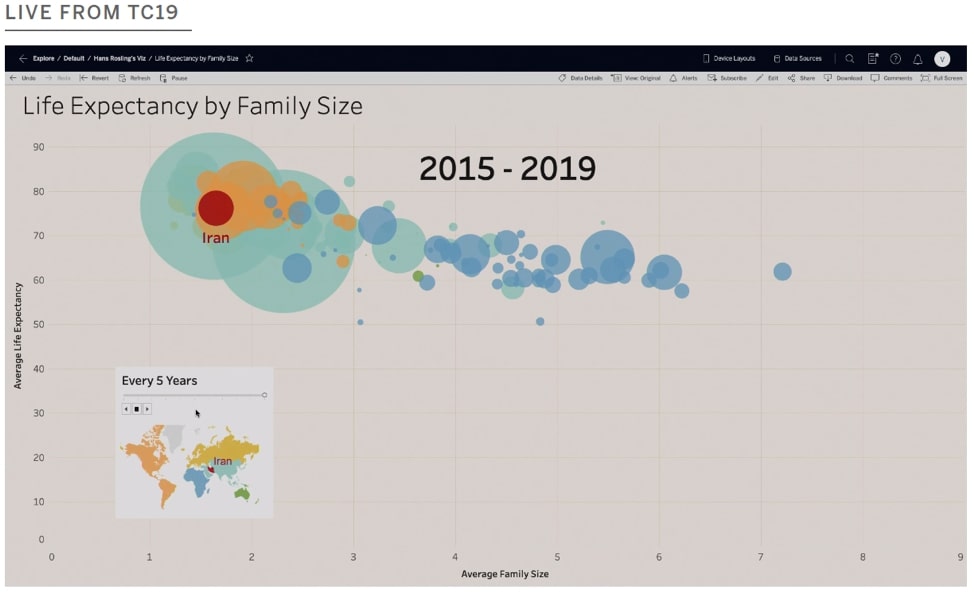
Above: Play button enabling animations to server
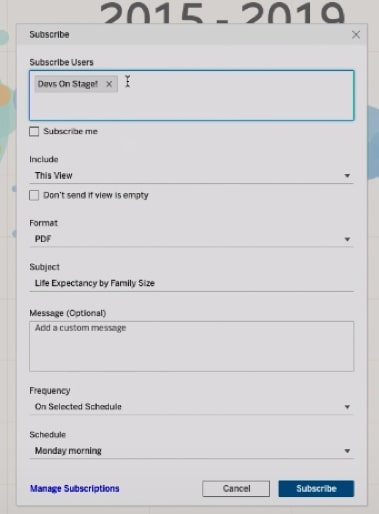
Subscriptions Allowing PDF Format
There was also a new format shown that allows subscriptions to send via PDF. Plus, a new schedule to only run when data is updated will be available:
Web Authoring in Tableau Public
One last feature shown by Victoria was web authoring, now available in Tableau Public:
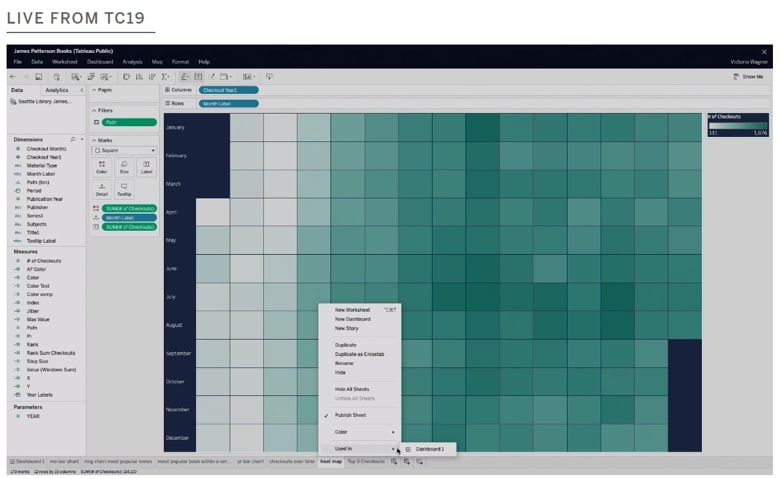
Tableau Prep
Next, Manpreet, a software engineer on the Prep team, discussed making data cleaning easier. New List view has been added when your number of columns makes looking at multiple bar charts in the profile view difficult to search:
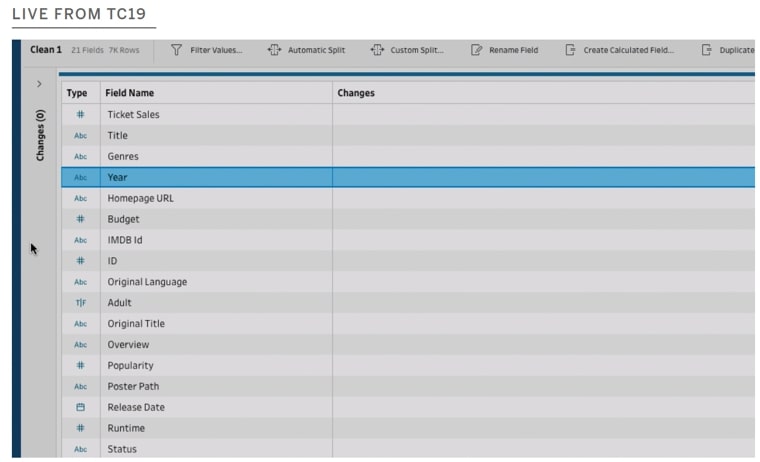
Above: New List view in Prep rather than the standard profile pane
Next on the agenda was the addition of LOD calculation, Rank support and re-usable steps to Tableau Prep. Great additions to the product that will save time and effort!
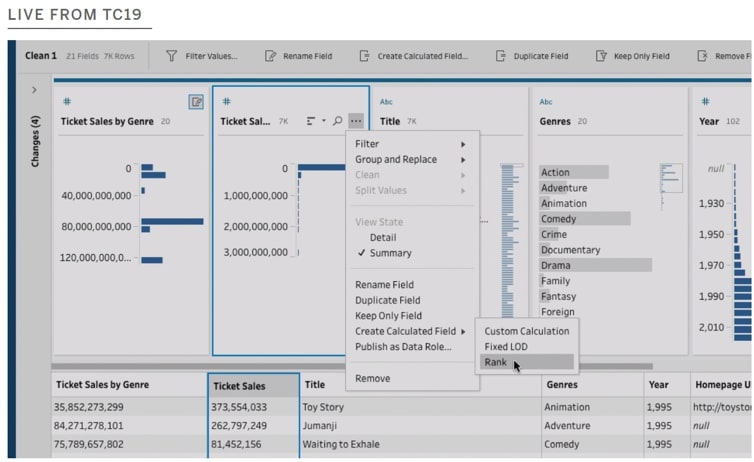
Above: Rank and LOD support using simple clicks to add
Data Modeling
Tyler Beauchamp, a developer on the data modeling team, then showed how to look at the big picture using a dataset around renewable energy. Using The Noodle, we can decide to join now or at the viz render steps. This means that no join planning is required due to the relationships in the data.
It also allows Tableau to determine the data model as you interact with the viz. It will form left, right and inner joins as you filter and exclude data in your viz, adjusting your data source on its own. It even allows you to use multiple fact tables and joins:
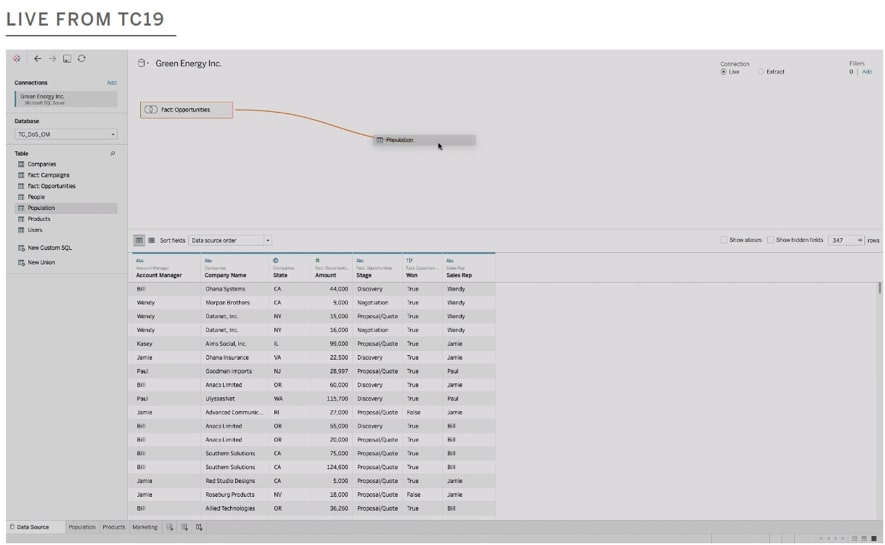
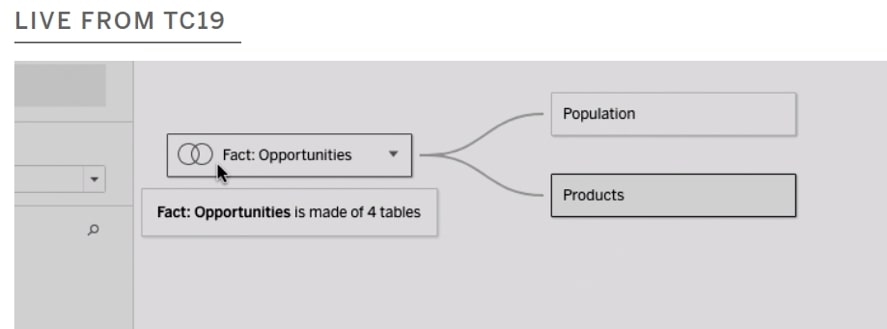
Above: The Noodle data source connection, allowing joins to be done at viz time
Tableau Server
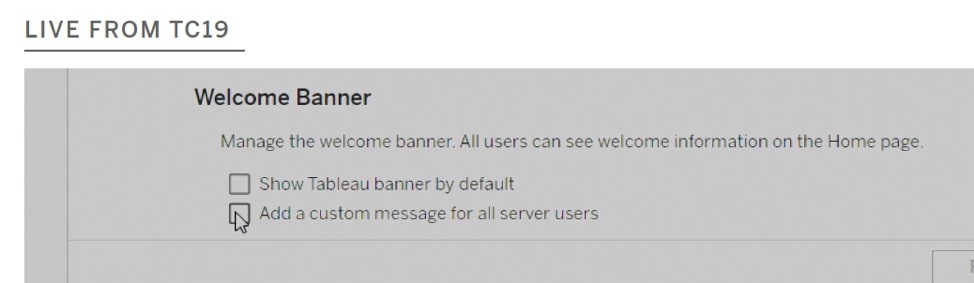
Sara Rantschler, a developer on the sustaining team and avid Pokémon fan, was next to show off new features on Tableau Server. First up were Custom Welcome Banners and Login Messages:
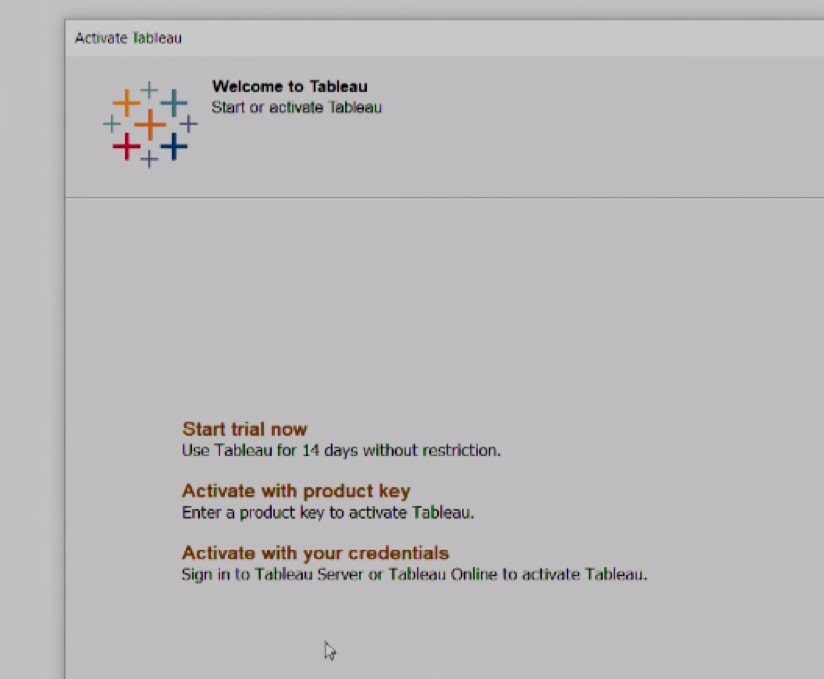
Server Administrators will love the new Login-Based License Management, which makes desktop keys a thing of the past. When a Creator is added, a new option will present itself in Desktop for activating with Server credentials:
Last up on the Server feature show was the Resource Monitoring Tool. This allows for a single view of all servers in one location. Being able to dig into every VizQL session, Data Query can identify why a view may have been slow by seeing all the environmental activities happening on the server in order to better spread out resources. Admins in the audience were drooling over this one…
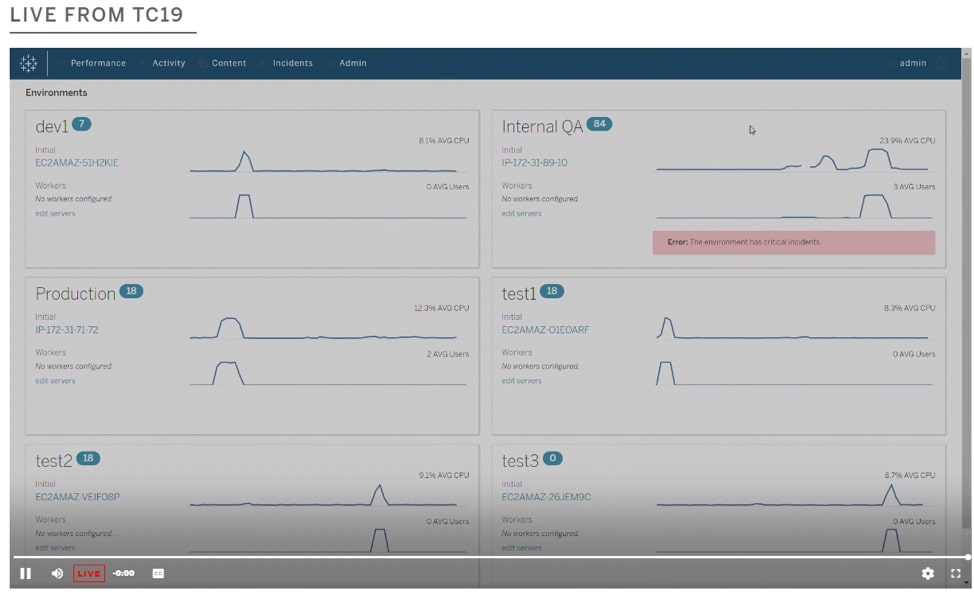
Above: Home page for the Resource Monitoring Tool
Dynamic Analytics
Filippos Lymperopoulos, a product manager on the Analytics team, was the next dev to share the stage. He discussed new functionality in sets called Set Control. Like a parameter control, you can now affect change on the viz by giving viz consumers the power to change a set origin:
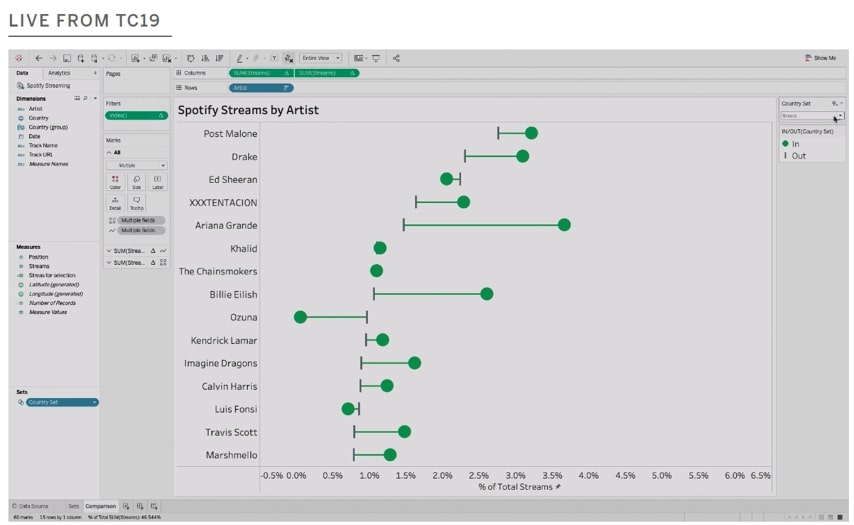
Above: Viz showing the set as circle and the rest of the world as bar. Set control exposed in the top-right corner allows the viz consumer to set the country.
Above: Set Control allows users to interact with author calculations. Rank on the left remains consistent, while the user adjusts the right side of the chart only.
Spatial Analytics
Buffer Calculations, also referred to as a boundary, are the next big development coming in future Tableau iterations for spatial data analysis. More than just visual overlays, they allow for joins between separate sources and allow for more complex visual creation:
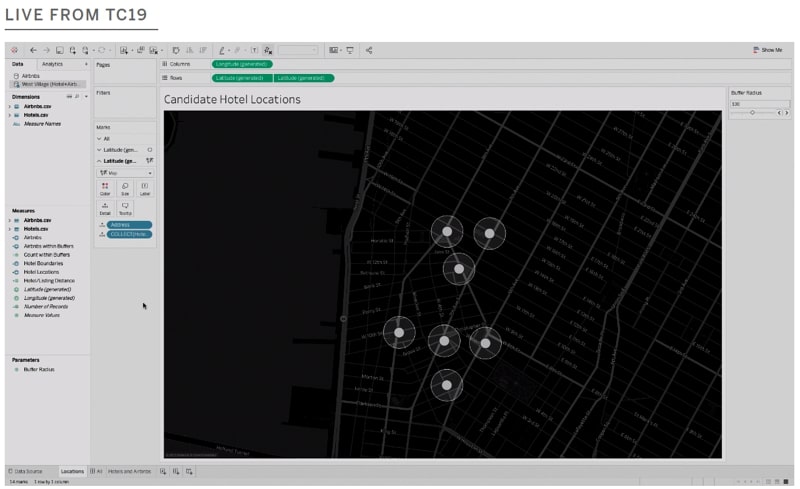
Above: Distance automatically shown using Buffer Calculations
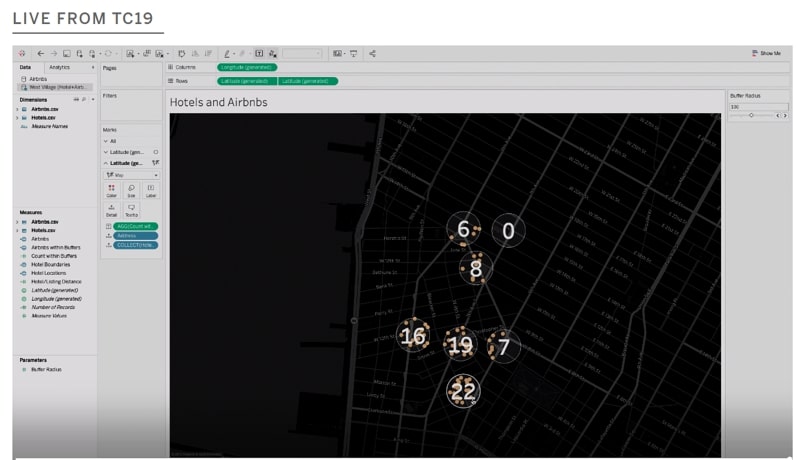
Above: Joining in and filtering from secondary source within the Buffer Calculation
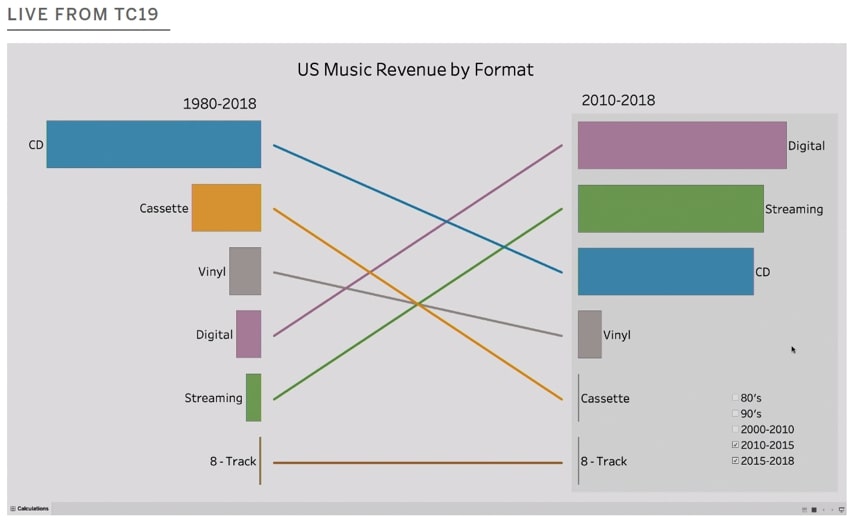
Dynamic Parameters
The number one feature request in the idea center seems to have finally become a reality. Dynamic Parameters are next to be on the big screen! The prospect of never updating and republishing parameters again had everyone on their feet. When a workbook opens, new options for updating on the parameter menus make dynamic updates a viable option. This also allows for programmatic control over your parameters, allowing for the most current date to be selected upon publication:
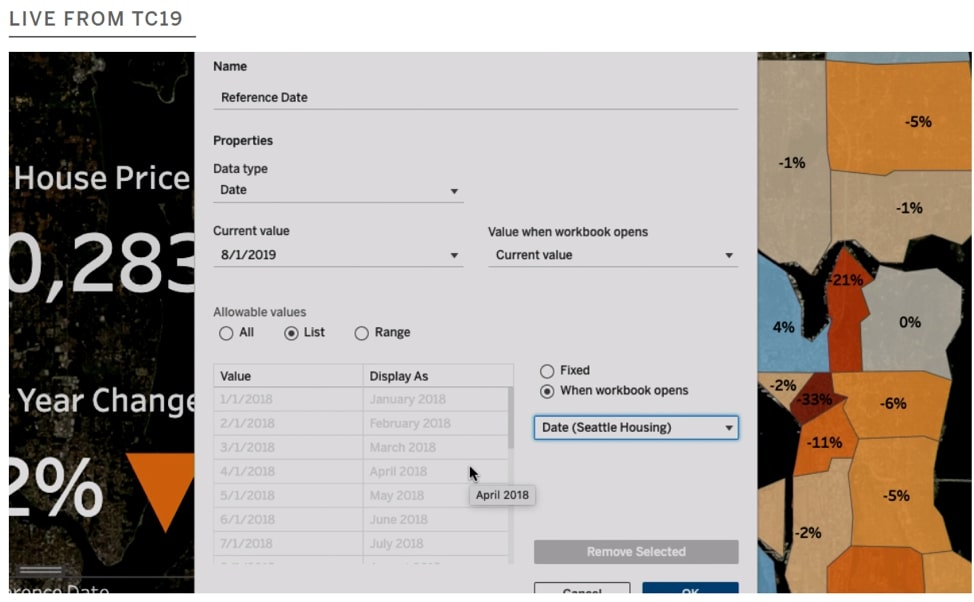
Above: Automatic updates to parameters
Let’s Talk!
Want to know more about how any new or existing features in Tableau can impact your organization? Reach out to our team, and let’s discuss how to maximize your analytics.