Quantified Office is a series in which we tackle interesting methods of data collection, analysis and visualization to quantify activities at InterWorks' offices.
In Part 1 of this series, I shared our Quantified Office Tableau dashboard and explained the idea behind it. In Part 2, I demonstrated how we created a “sunrise chart” in Tableau. By now, you are likely wondering how exactly we gathered the data for our kitchen experiment. With the combined technology of IFTTT and a WeMo motion sensor, gathering our data could not be easier!
If you are not already familiar with IFTTT, it is a web site dedicated to connecting different pieces of technology together. It supports many things like RSS feeds, Slack, Facebook and Twitter. Luckily for us, it also interfaces with home automation devices, such as Nest, Philips Hue Lights and even our WeMo sensor. Best of all, the interface could not be simpler to use!
How It’s Done
First, you will need an IFTTT account. Go to http://ifttt.com to register. This website also serves as the interface we will use to setup our data collector.
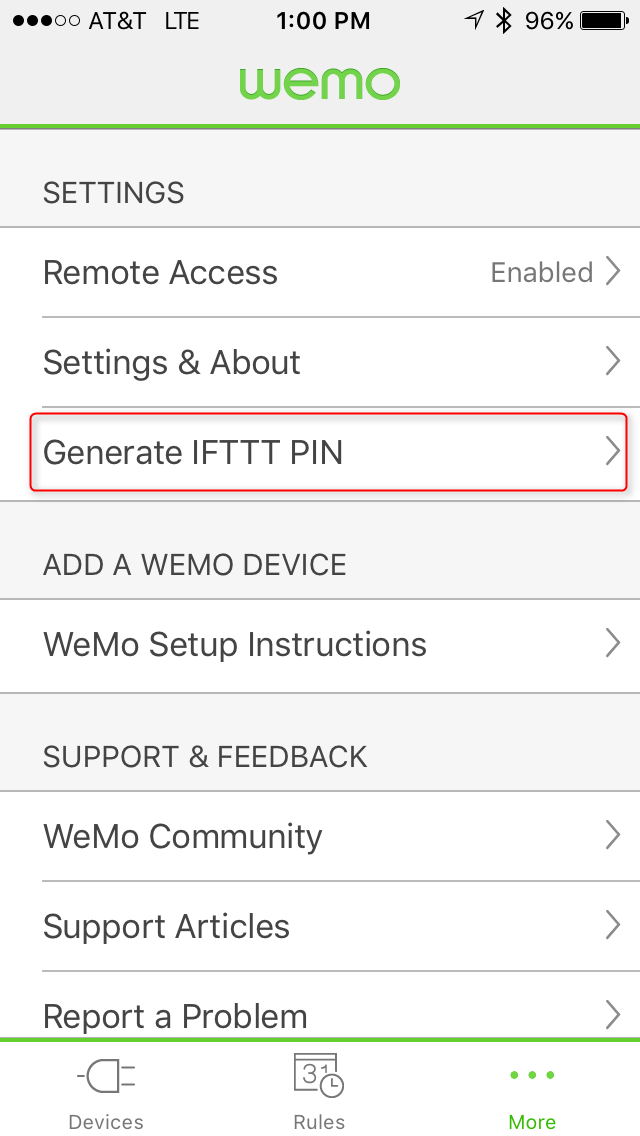
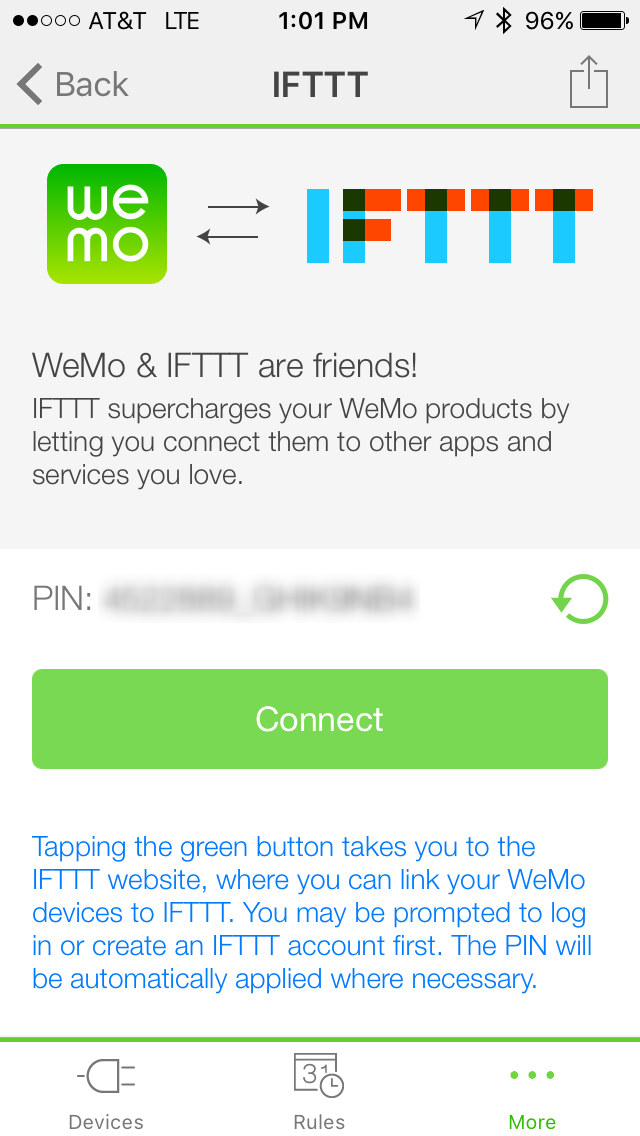
Next, set up your motion sensor. Plug in the sensor somewhere and connect it to the WeMo phone app to get started. Once you have the Wemo setup, click the More link at the bottom of the app to get to the settings page. On this page, you will see Generate IFTTT PIN. Using this interface, you can connect your WeMo device to IFTTT.
For logging our data, we will use a simple IFTTT connection to log to a Google Doc Spreadsheet. IFTTT refers to these types of connections as “recipes.” To create a new recipe, go to the IFTTT website in a browser. Log in and click My Recipes. Next, click Create a Recipe.
Once you get to the IFTTT recipe creation page, you will be able to click the blue this text to see a plethora of trigger options. In our case, we want the WeMo Motion channel. You can configure the motion event to work in one of two ways: any motion after a certain quite period or any new motion at all. For our visualization, I used Any New Motion.
In the that area, select Google Drive. Google Drive’s channel allows you several options, but Add row to spreadsheet is the one we want.
When creating the new action, you can specify the path that you want IFTTT to write to and the data. I used DetectedAt as my only data; but if you had several sensors, you could want SensorName too.
Finally, click Create! This will arm the motion sensor and start logging data. After a few days (or weeks), simply download the file and start dashboarding!