In most real world data sets, we want to compare “year over year” values. How were we doing last year? How does that compare to this year?
Monitoring these comparisons can provide valuable insights to your business; however, the calculation is cumbersome and slow to generate in Tableau.
Whenever possible, instead of doing window calculations in Tableau to return these values, I move these calculations to the database. Having these values calculated in the database allows us to easily use two separate fields for our values – a current year field and a previous year field.
Tableau developers will rejoice when they are able to use these fields instead of creating window calculation. Meanwhile, the increased speed in your views will ensure your Tableau users will be much happier, as well.
How It’s Done
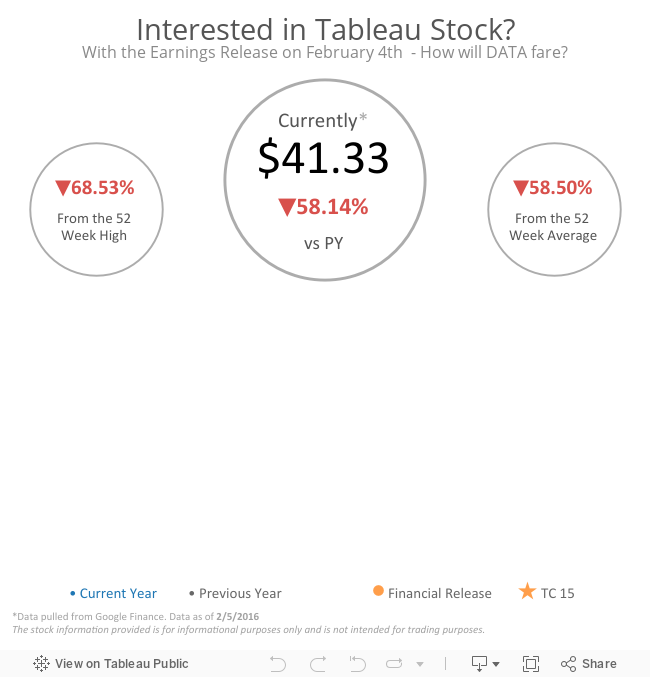
For our example, I am going to use DATA’s stock price data pulled from Google Finance. The data is attached as both a tab delimited .txt file and a .sql file to the end of this post. It is current as of 1/14/2016. We are going to use SQL Server for our pivot, but I’m purposely using a fairly generic approach that can be implemented similarly in most modern databases.
Our base table contains a few metrics: Open, High, Low, Close and Volume. We have two dimensions: CalDt and Stock. We could easily have more here, depending on your data needs.
To start, we need to get all the distinct dimensions. In this data set, we only have two. In most data sets, however, you will have a handful. In most cases, we need all dates – whether or not the stock has data for a particular day. For example, in a retail store, a single SKU may not be sold one day, but we need to fill in a “0” for this date if they have data in the previous year. Because this is stock data, we can run into a scenario where the market is closed on a Current Year date that was open last year (for example, the market is closed on 1/18/2016 but was open on 1/18/2015). To work around a missing row for a particular date + dimension value, first get all of the unique dates:
SELECT DISTINCT CalDt
FROM [dbo].[data_stockprice];
We don’t want to lose data on closed dates, so let’s add in CalDt + 1 Year and CalDt – 1 Year. We only want data up until our current date, though, so we should add in a WHERE condition to limit our data dynamically:
SELECT DISTINCT CalDt
FROM (
	SELECT DISTINCT CalDt
	FROM [dbo].[data_stockprice]
	UNION ALL
	SELECT DISTINCT DATEADD(Year, 1, CalDt)
	FROM [dbo].[data_stockprice]
	UNION ALL
	SELECT DISTINCT DATEADD(Year, -1, CalDt)
	FROM [dbo].[data_stockprice]
) Dates
WHERE CalDt < (SELECT MAX(CalDt) FROM dbo.data_stockprice)
Now, let’s join in the other dimensions. To do this, we will want to join our dates against our unique dimensions. We want to keep any dimensions that have data in the current or previous year data, so we will reflect that in our join condition:
SELECT DISTINCT
	Dates.CalDt
	, Stock
FROM
(
	SELECT DISTINCT CalDt, DATEADD(Year, -1, CalDt) AS PY_CalDt
	FROM (
		SELECT DISTINCT CalDt
		FROM dbo.data_stockprice
		UNION ALL
		SELECT DISTINCT DATEADD(Year, 1, CalDt)
		FROM dbo.data_stockprice
		UNION ALL
		SELECT DISTINCT DATEADD(Year, -1, CalDt)
		FROM dbo.data_stockprice
	) D
	WHERE CalDt < (SELECT MAX(CalDt) FROM dbo.data_stockprice)
) Dates
INNER JOIN (
	SELECT DISTINCT CalDt, Stock
	FROM dbo.data_stockprice
) Dim ON (
	Dim.CalDt = Dates.CalDt OR
	Dim.CalDt = Dates.PY_CalDt
);
Now we have our dimensions! Let’s add some measures. To do so, we need to use LEFT JOIN to get our previous year and current year data. We only have a limited data set, but let’s assume that we had measures here that we need to SUM(). In retail data, this could easily be SlsUnits or RetailDollars. In order to get our multiple rows out, without exploding our data, we need to pre-sum the data to the same grain as our unique dimensions. In SQL Server, you can do this with a CTE; but we will use a subquery to make the code reusable in other databases:
SELECT
	CalDt
	, Stock
	, SUM([Open]) AS [Open]
	, SUM([High]) AS [High]
	, SUM([Low]) AS [Low]
	, SUM([Close]) AS [Close]
	, SUM([Volume]) AS [Volume]
FROM dbo.data_stockprice
GROUP BY CalDt, Stock
We will use this subquery twice with different join conditions: one for the current year’s data and one for the previous year’s data:
SELECT
	Dim.CalDt
	, Dim.Stock
	, CY.[Open]   AS CY_Open
	, CY.[High]   AS CY_High
	, CY.[Low]    AS CY_Low
	, CY.[Close]  AS CY_Close
	, CY.[Volume] AS CY_Volume
	, PY.[Open]   AS PY_Open
	, PY.[High]   AS PY_High
	, PY.[Low]    AS PY_Low
	, PY.[Close]  AS PY_Close
	, PY.[Volume] AS PY_Volume
FROM
(
	SELECT DISTINCT Dates.CalDt, PY_CalDt, Stock
	FROM (
		SELECT DISTINCT CalDt, DATEADD(Year, -1, CalDt) AS PY_CalDt
		FROM (
			SELECT DISTINCT CalDt
			FROM dbo.data_stockprice
			UNION ALL
			SELECT DISTINCT DATEADD(Year, 1, CalDt)
			FROM dbo.data_stockprice
			UNION ALL
			SELECT DISTINCT DATEADD(Year, -1, CalDt)
			FROM dbo.data_stockprice
		) D
		WHERE CalDt < (SELECT MAX(CalDt) FROM dbo.data_stockprice)
	) Dates
	INNER JOIN (
		SELECT DISTINCT CalDt, Stock
		FROM dbo.data_stockprice
	) Dim ON (
		Dim.CalDt = Dates.CalDt OR
		Dim.CalDt = Dates.PY_CalDt
	)
) Dim
LEFT JOIN (
	SELECT
		CalDt
		, Stock
		, SUM([Open])   AS [Open]
		, SUM([High])   AS [High]
		, SUM([Low])    AS [Low]
		, SUM([Close])  AS [Close]
		, SUM([Volume]) AS [Volume]
	FROM dbo.data_stockprice
	GROUP BY CalDt, Stock
) CY ON (
	CY.CalDt = Dim.CalDt AND
	CY.Stock = Dim.Stock
)
LEFT JOIN (
	SELECT
		CalDt
		, Stock
		, SUM([Open])   AS [Open]
		, SUM([High])   AS [High]
		, SUM([Low])    AS [Low]
		, SUM([Close])  AS [Close]
		, SUM([Volume]) AS [Volume]
	FROM dbo.data_stockprice
	GROUP BY CalDt, Stock
) PY ON (
	PY.CalDt = Dim.PY_CalDt AND
	PY.Stock = Dim.Stock
);
Looking at the data this produces, you can see why we had to jump through hoops to get accurate data. The weekends are offset, as well as most holidays. By doing the left joins, however, we don’t lose any data and are able to view the current year versus previous year data correctly. Any nulls will be fine in the data, as long as we don’t look at exact single day comparisons.
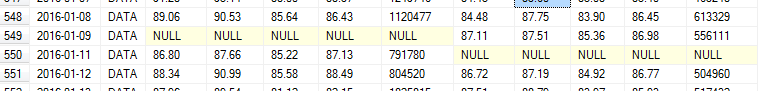
Date information, such as “business week,” “fiscal month” or whatever your organization uses can be added to the query to make comparisons even easier. Adapting this basic query to your data, you should find multiple options to make analysis easier and easier in Tableau.
The End Product
With all of that done, we have our final product in the form of the Tableau dashboard below: