March Madness Brackets Visualized in Tableau

Data

March Madness Brackets Visualized in Tableau

by Cory Jez
//

(Cues Music) “It’s the most wonderful time, of the year …”

No, it’s not Christmas or New Years – it’s March 20. That can only mean one thing: The NCAA Men’s Basketball Tournament. For the past four days, people everywhere have been filling out their brackets feverishly in hopes of snagging a cool $1 Billion from Warren Buffet’s wallet. We at InterWorks have been busy too, not only filling out our brackets, but visualizing them as well. 

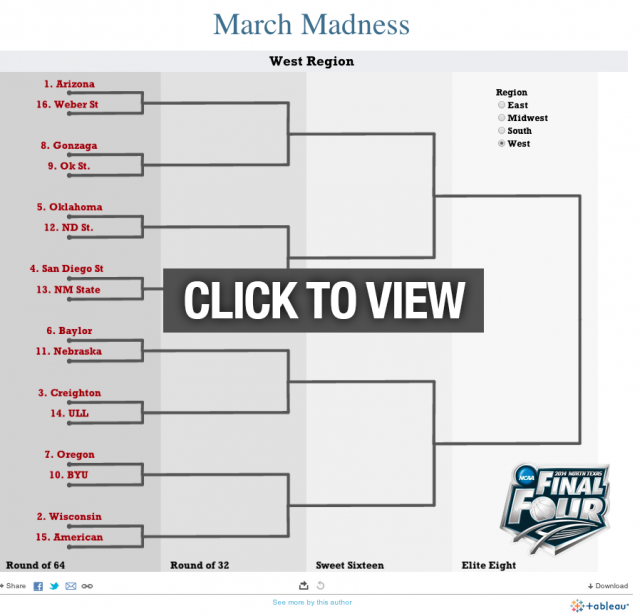
I wanted to come up with a way to visualize my bracket in Tableau, but (believe it or not!) “NCAA Bracket” isn’t a default Show Me option. While it takes some heavy lifting on the back end, it certainly is possible to build out a bracket-style viz in Tableau. I will be updating the bracket at the end of each round, so check back to see how the final product looks.

Click on the image below to see the bracket. In the coming days, I’ll update the post with a more in-depth “how to” on the bracket. Happy March Madness!

More About the Author

Cory Jez

Business Intelligence Analyst
2014 FIFA World Cup Visualized in Tableau – Group G Outcomes If you cried as much as I did as the U.S. Men’s National Team settled for a draw against Portugal last night, then you’ve probably ...
Not Applicable is Applicable – Handling ‘N/A’ in Tableau Mapping Tableau’s “out of the box geocoding” functionality creates a wealth of opportunities for users to create beautiful maps almost ...

See more from this author →

InterWorks uses cookies to allow us to better understand how the site is used. By continuing to use this site, you consent to this policy. Review Policy OK

×

Interworks GmbH
Ratinger Straße 9
40213 Düsseldorf
Germany
Geschäftsführer: Mel Stephenson

Kontaktaufnahme: markus@interworks.eu
Telefon: +49 (0)211 5408 5301

Amtsgericht Düsseldorf HRB 79752
UstldNr: DE 313 353 072

×

Love our blog? You should see our emails. Sign up for our newsletter!