
Recently, I’ve found myself setting up dashboards with navigation panes for one reason or another. Whilst this could be accomplished with a parameter-based drop-down or by navigating to different dashboards, if speed isn’t a concern, then it can be a great boost to the user experience by having a single row/column of options to choose from. Regardless of whether or not this is an optimal solution, it resonated well with our target audiences and helped with the transition from other tools towards Tableau.
This post will walk through how I created the navigation for the following example on Tableau Public:
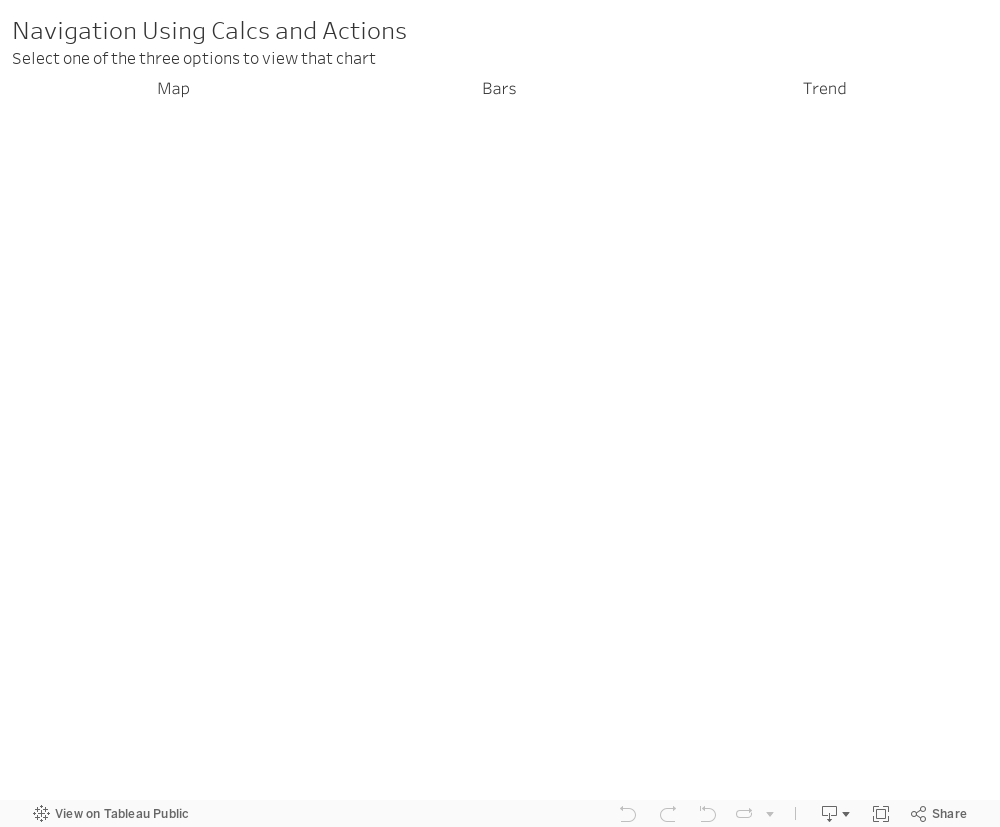
How to Build This Yourself
Once you know how to set up this kind of navigation, it is very simple to adapt to your own needs. First, think about which options you want to be available and build those options. In our example, I have built a map, a bar chart and a trend view. If I wanted, I could extend this list or even combine some. For this example, however, I would like my users to simply select one of these three sheets to view.
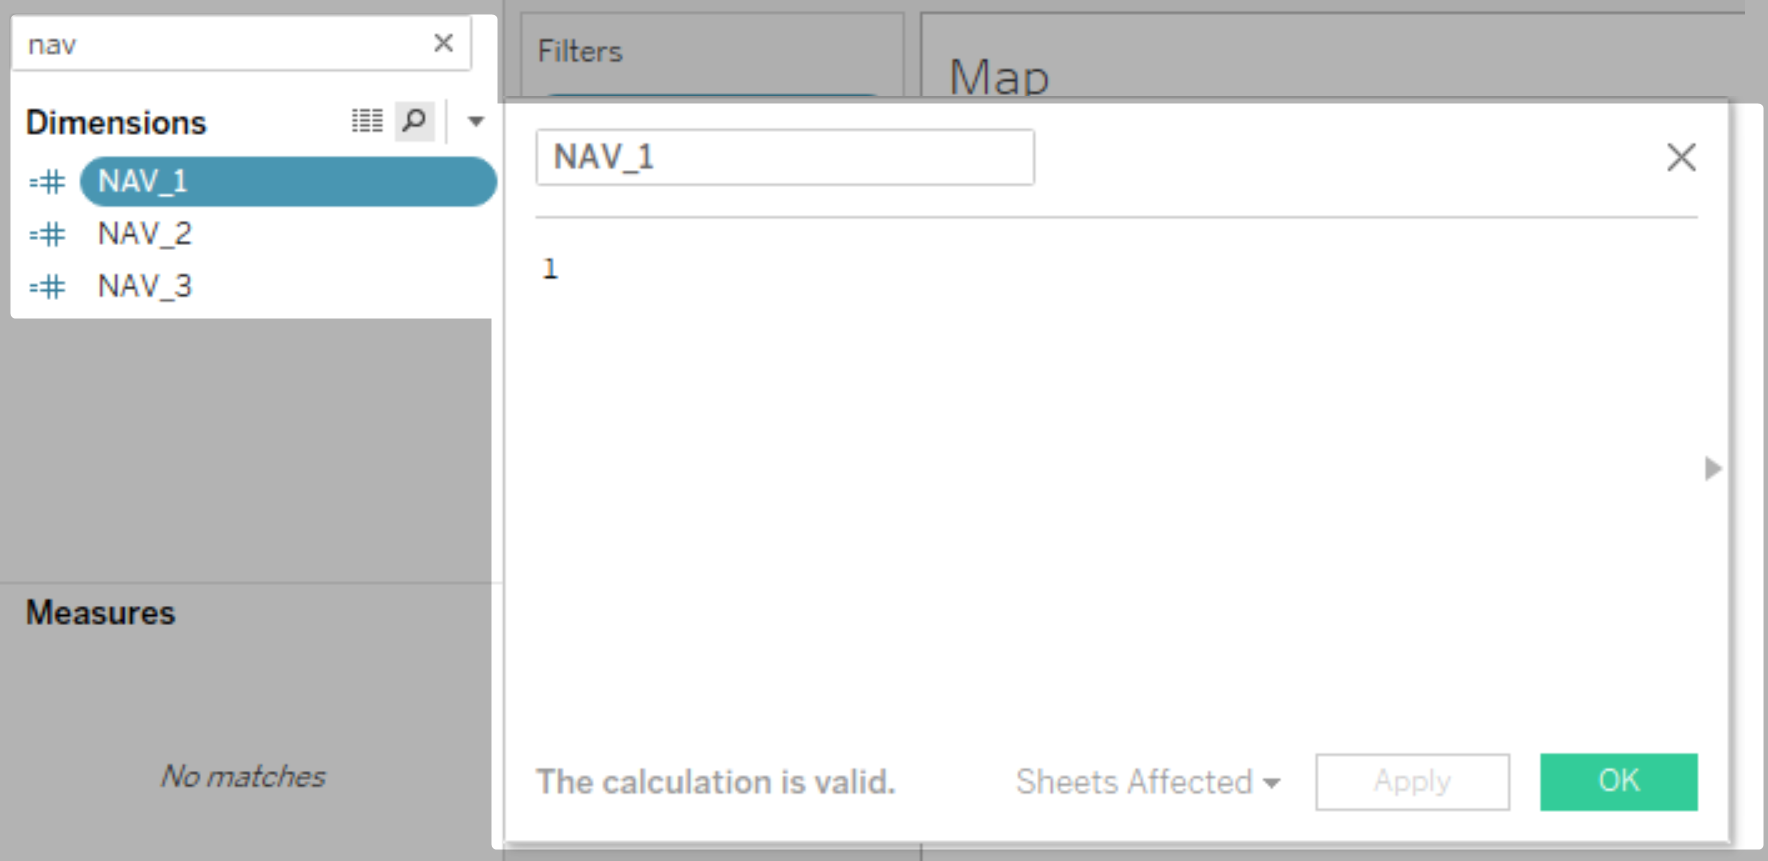
The Calculations
I will need a calculated field for each of my navigation options. Knowing that I have three options, I know that I will need three calculated fields. Each of these calculated fields is very similar, containing a single integer. I have called these NAV_1, NAV_2 and NAV_3, giving the values 1, 2 and 3 respectively. These are also set to be dimensions.
The Navigation Sheet
Here I have made use of ad hoc calculations to create multiple columns in my sheet. Each of these calculations outputs Min(0) as this is computed quickly and provides a continuous axis. I have named each calculation by adding a comment to the start of the calculation, for example the Map column uses the following calculation:
//Map
Min(0)

Each of these columns will now have its own Marks card. Pulling in another ad hoc calculation for a blank string, we can then add text to each of these columns. The ad hoc calculation I have used for my text is:
//Text
‘’
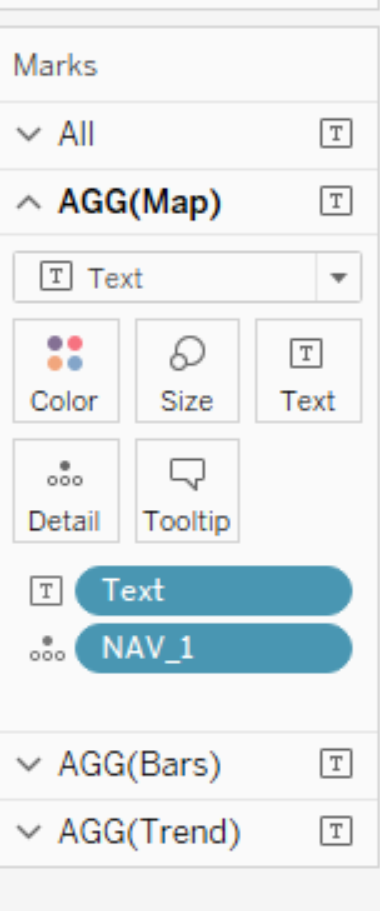
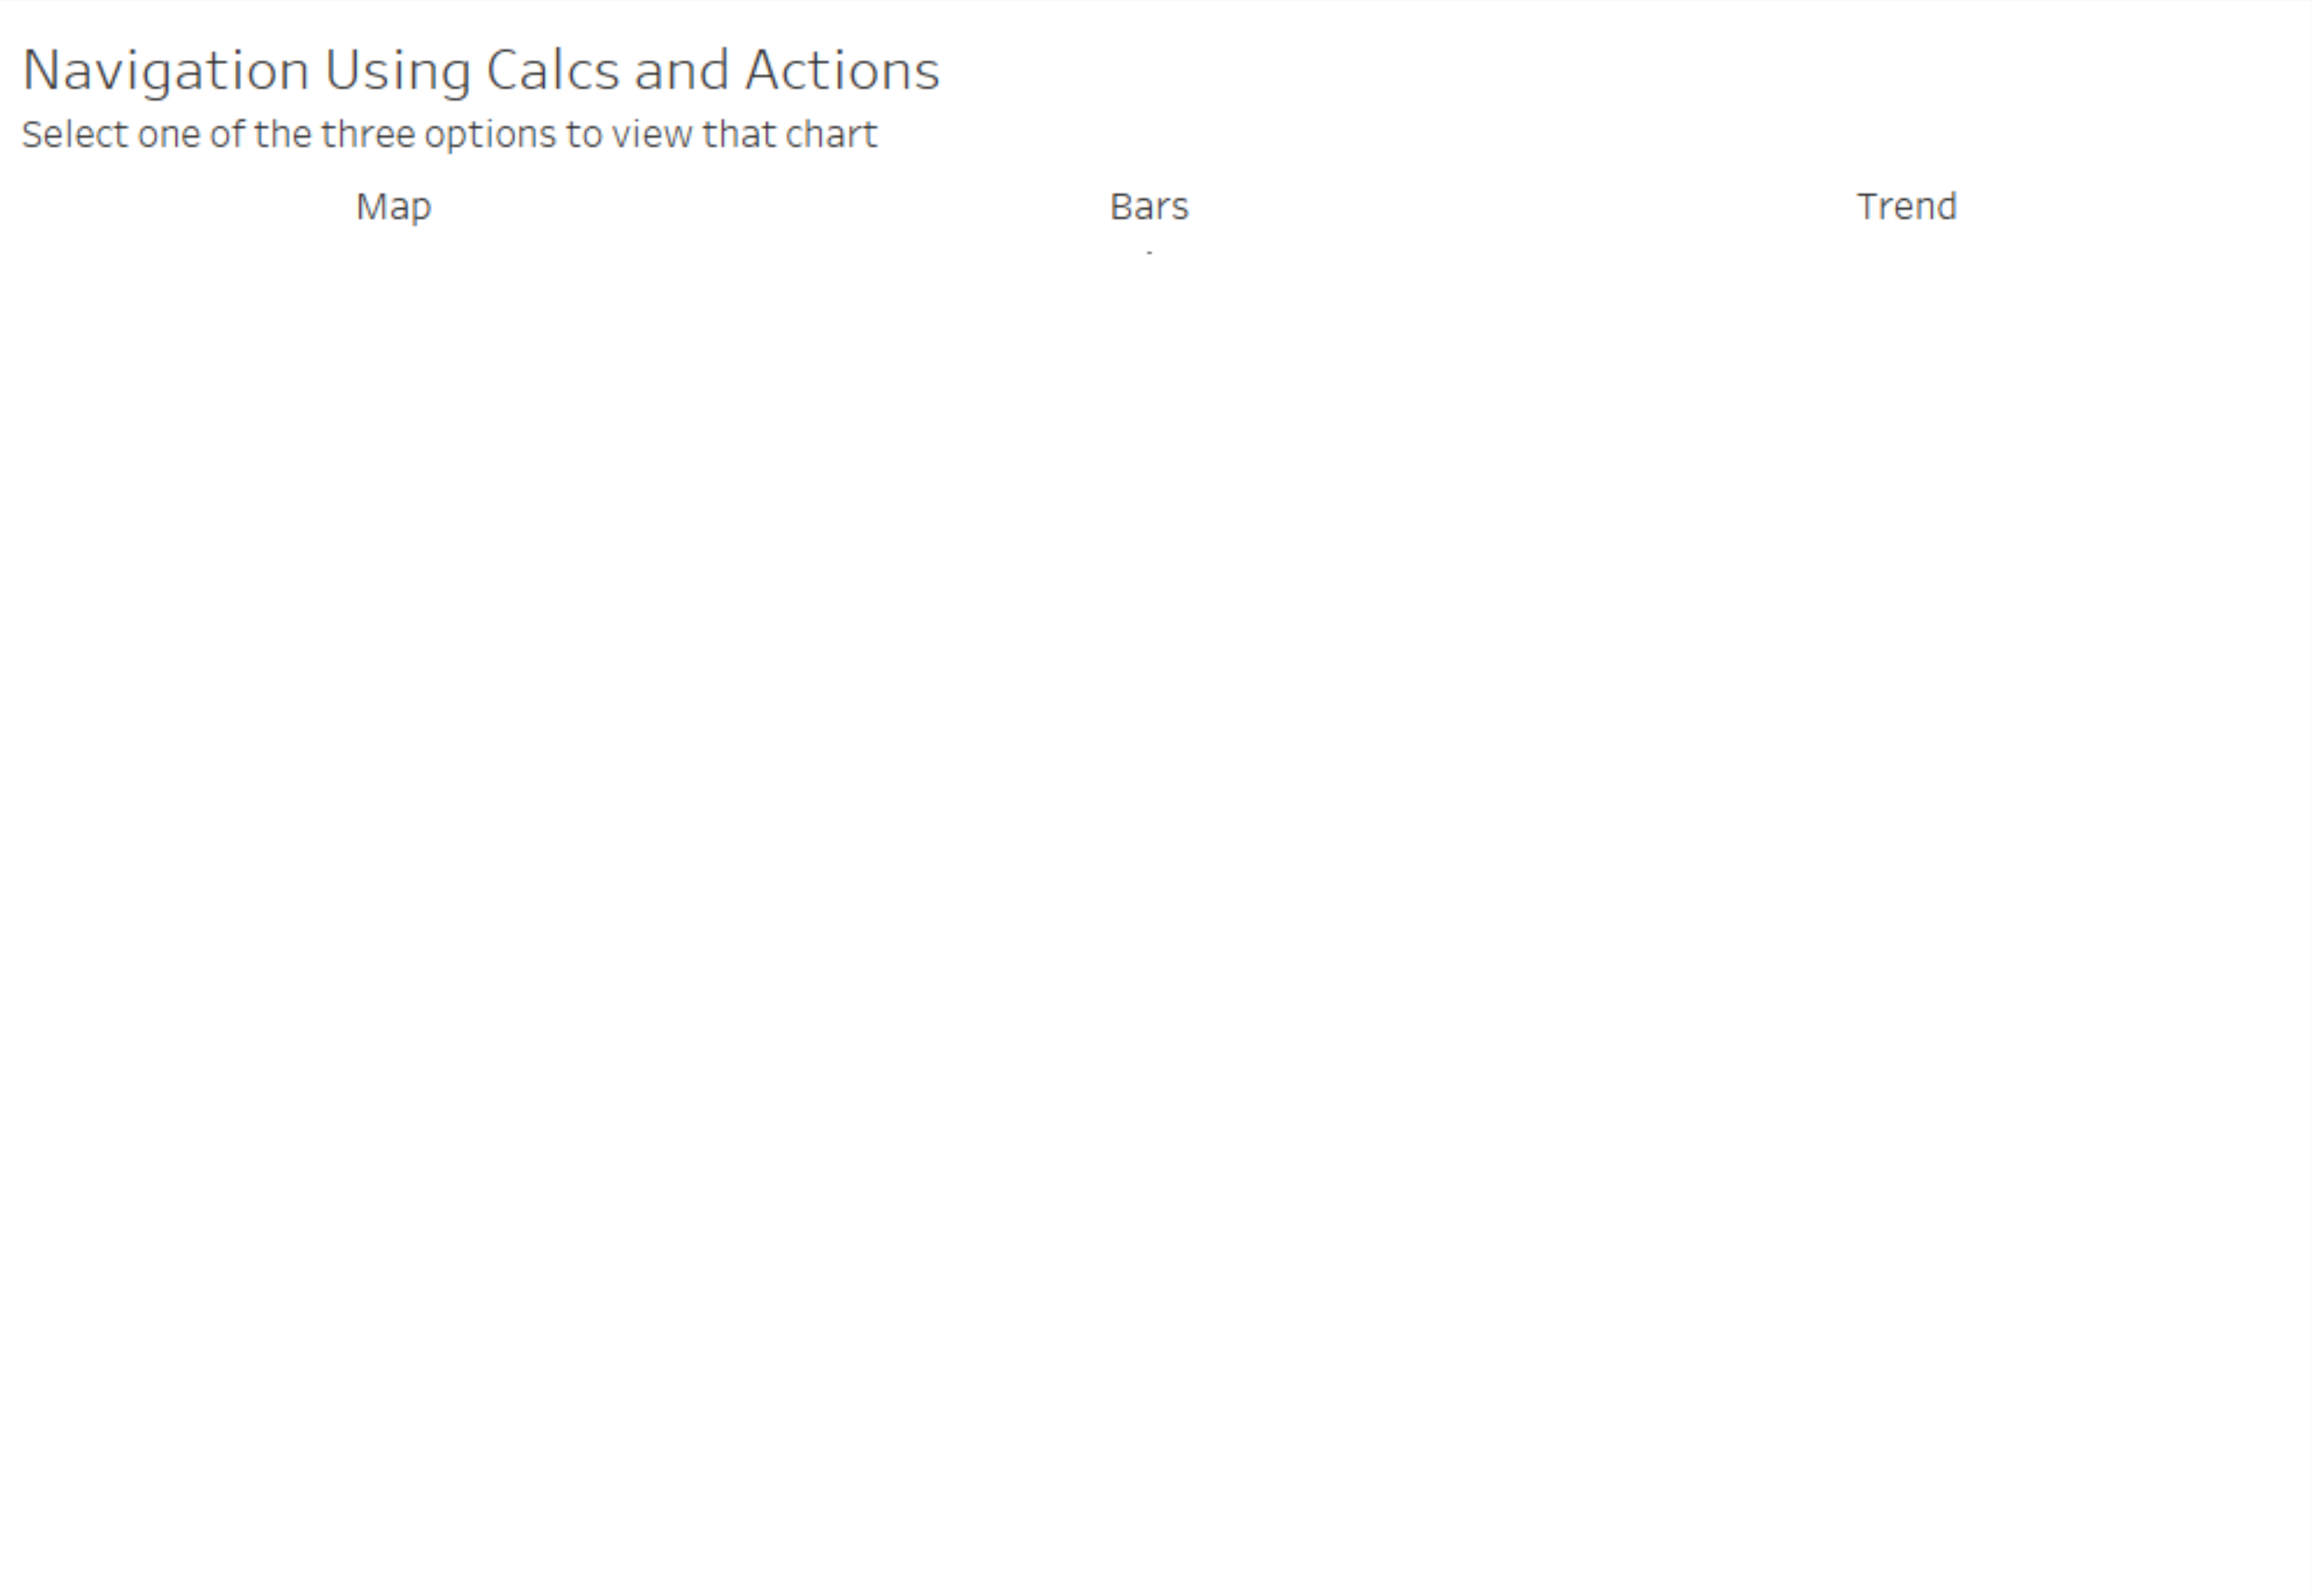
This gets us most of the way there with our navigation sheet:

From here, it remains to add our calculated dimensions to each of our options by pulling the corresponding dimension into the Detail mark for each of our three marks. I have added NAV_1 to the detail of my Map mark, NAV_2 to the detail of my Bars mark and NAV_3 to the detail of my Trend mark.
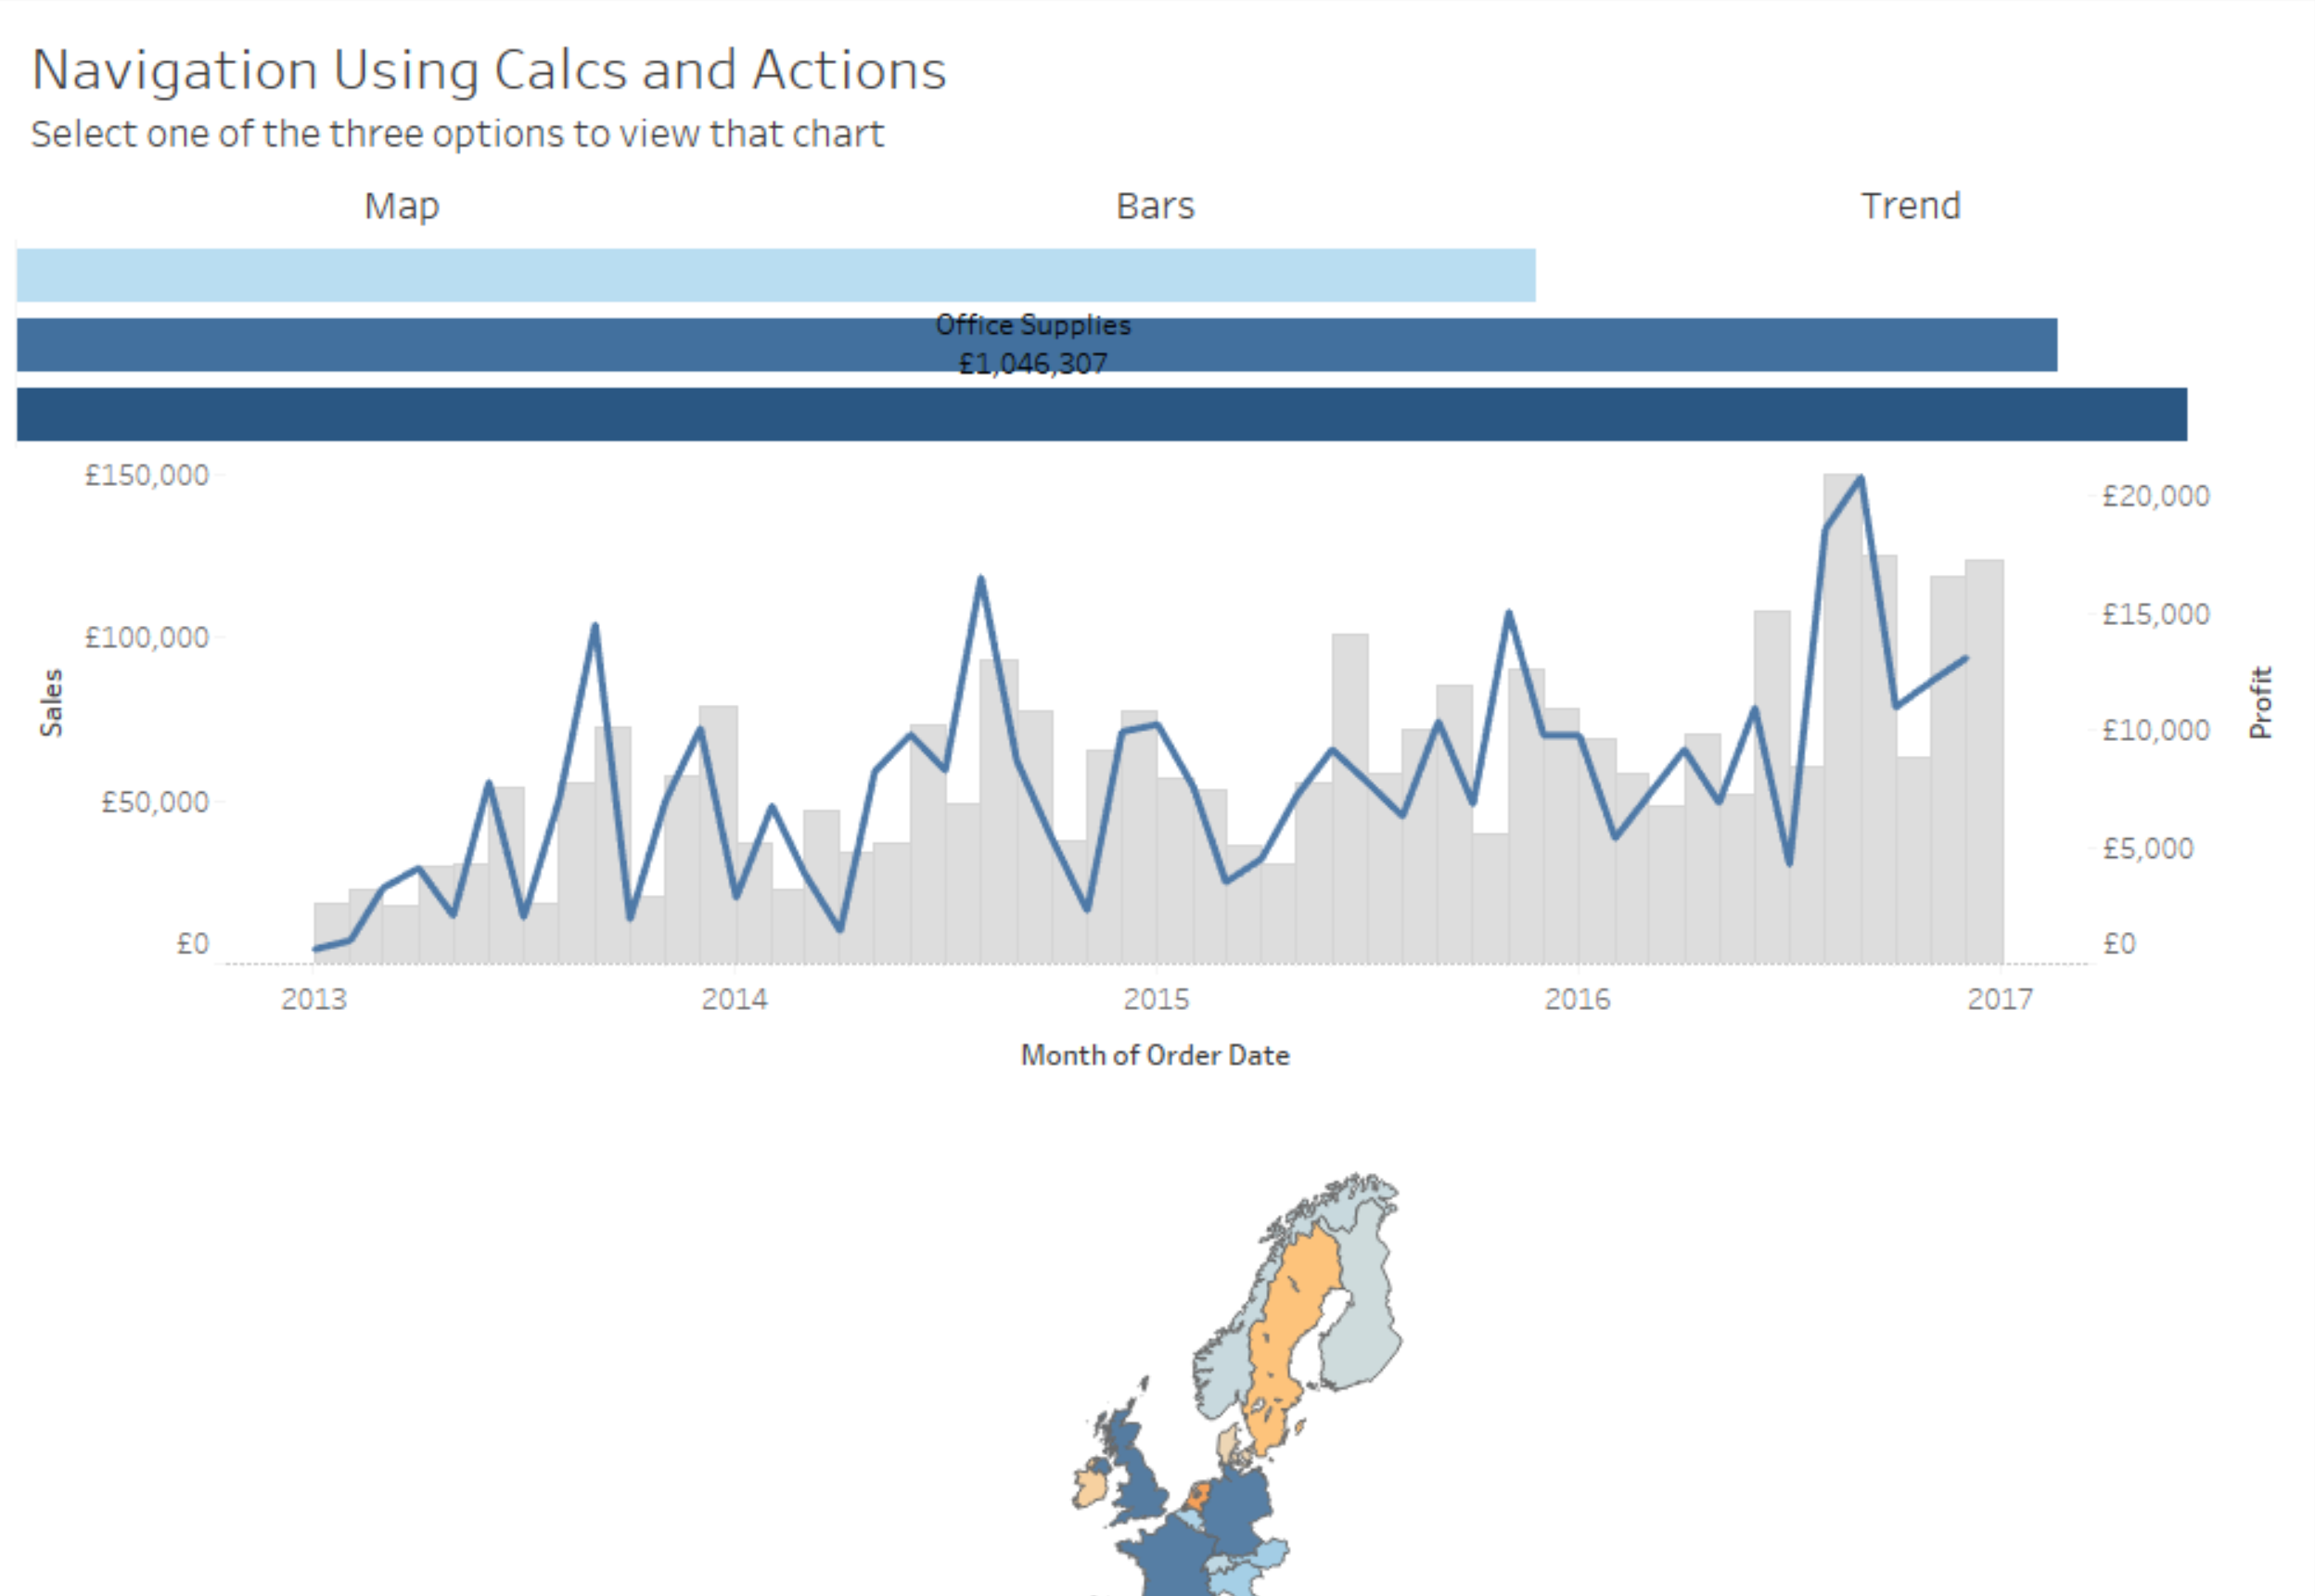
Building the Dashboard
Now that we have each of our sheets built, we can pull these into a dashboard. I have put each of the various options inside a single vertical layout container and set each to Fit Entire View. The goal here is to ensure that when the other options are hidden, the selected option fits the page. In our case Fit Height could also have worked. The only other elements on my dashboard are a title at the top and the Navigation sheet. I will gladly admit that at this stage the dashboard does not look very nice; however, we are about to fix this:
The Action Filters
The final step to creating our navigation is creating the actions. An action is required for each option for navigation. The action should start when the Navigation sheet is selected and the desired option is targeted, sending the relevant NAV_ calculated field to the target sheet. Finally, set this to Exclude all values when the selection is cleared:
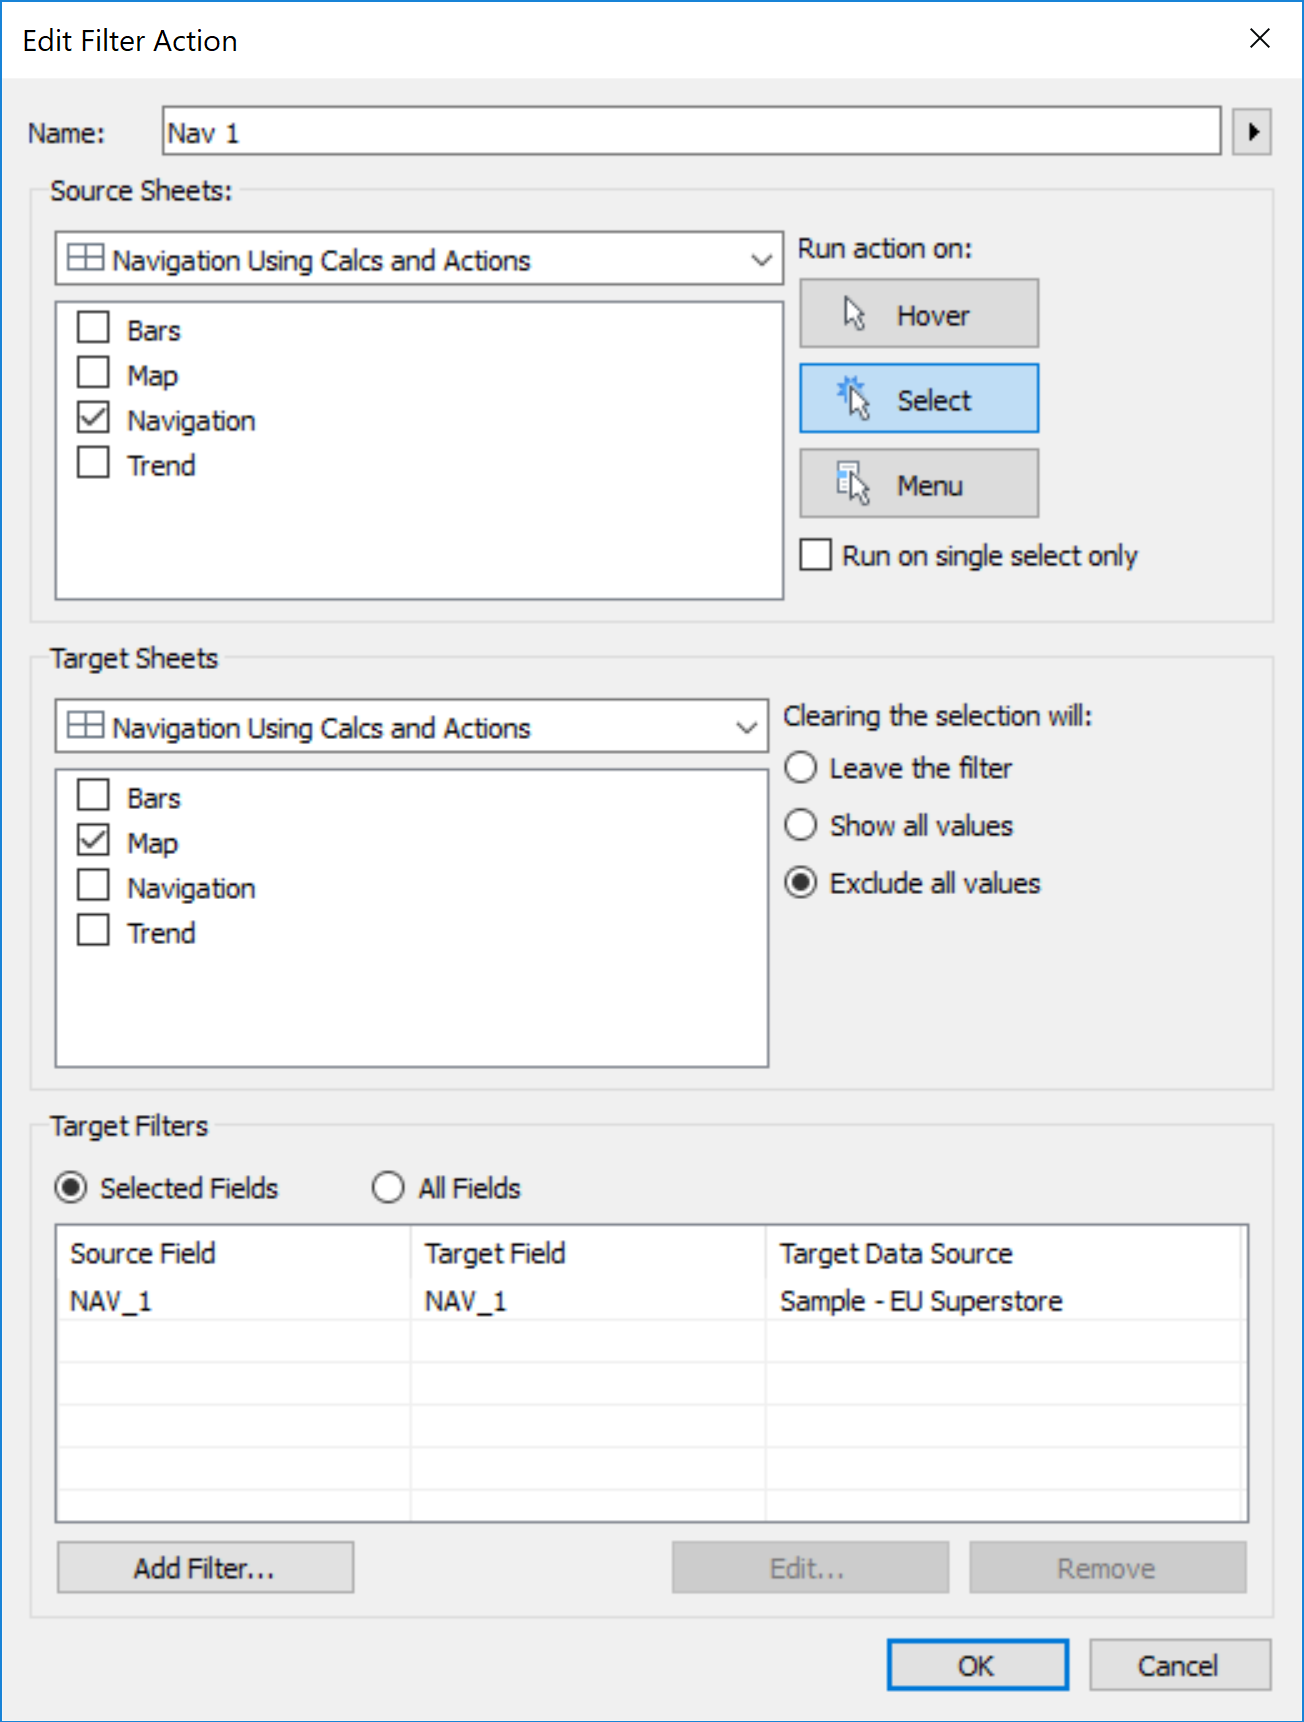
This is the final step towards setting up your navigation. Select each of your options so that the action is triggered, then deselect the last option to hide the final sheet as in the image below:
Potential Next Steps
From here there are a few interesting directions to take. One path is to extend your list of options or even combine some, for example selecting a certain option could show two charts side by side in a horizontal container. Another path that I find interesting is to create multiple navigation sheets and create ways for them to interact. You can force certain sheets to be hidden by creating a slightly different action which sends a NAV_ entry to a different number. For example sending NAV_1 into NAV_2 uses the logic that 1 ≠ 2 to force that particular sheet to hide. This can then be shown again by using a different option or sheet to send the NAV_2 value to that sheet, returning to 2 = 2.
I hope you all find this helpful. Let me know in the comments below if you use this in any interesting ways!