
This blog post is Human-Centered Content: Written by humans for humans.
Want a visual walkthrough of this post? Check it out here, and follow along below:
For the last five years, I’ve worked almost exclusively in Power BI across several roles, with most of my focus on revenue forecasting. Even before my BI journey began, I was involved in revenue modeling for B2B sales. Over time, I’ve seen how non-technical sales teams often try to extract financial insights from various systems or pull analysts in at the last minute to make it all work in Excel.
When I transitioned from Excel to Power BI, it was a huge improvement for reporting production. The automation, governance and scalability were game-changing. The tradeoff, though, was the flexibility to set up dynamic models that could facilitate scenario analysis. For the most part, Excel still wins when it comes to empowering users to modify data on the fly and analyze updated results. Despite many cool, somewhat hacky workarounds in Power BI, translating Excel-like interactivity has never felt smooth enough.
By entering the domain of a BI tool, users typically shift into more of a view-only mode of data consumption. I think this is a big reason why all too frequently we get the cliché request at the end of a demo for instructions to (and apologies if reading this for the millionth time causes you physical pain) extract results to Excel.
My recent introduction to Sigma was a major breath of fresh air, as its capabilities to facilitate user interactions within a BI tool far outshine anything else I have seen. It offers the scalability and governance of a modern BI tool, but with the hands-on interactivity that business users love.
The Problem: Why CRM Forecasting Needs a Better Solution
My Sigma journey kickstarted with this Pipeline Forecasting App project, inspired by a real-world forecasting processes I’ve seen in the wild.
In B2B sales, teams rely heavily on CRMs like Salesforce where sales reps live and breathe to manage their day-to-day. Leveraging that pipeline data for forecasting makes sense, insofar as systems are properly configured to suit the needs of sales, operations, and finance.
However, CRMs can be difficult to configure. They often require specialized technical support to update, and ultimately struggle to keep pace with rapidly changing business demands. Furthermore, it can be an ever-present challenge to ensure sales teams keep their CRM fully up to date amidst competing priorities. So when it comes time to leverage this data for forecasting, teams end up back in Excel, where they can manipulate their data and make adjustments freely.
This problem stretches beyond this use case and is likely more universal: You start with real data, make some custom adjustments and model a forecast with a bunch of manual work.
The Solution: Sigma Combines CRM Data with Excel-Like Flexibility
The app I built in Sigma aims to bridge the gap to combine well-governed, CRM data-supported forecasting with user input flexibility. It uses CRM data as a baseline, applies basic business rules (which opportunities to include or exclude in a forecast), and then gives users the ability to adjust results, create multiple scenarios and finalize forecasts all within the app.
The real magic happens at the end: Sigma’s write-back capability pushes finalized forecasts directly into your data warehouse. That means instant, clean and shareable access across the organization.
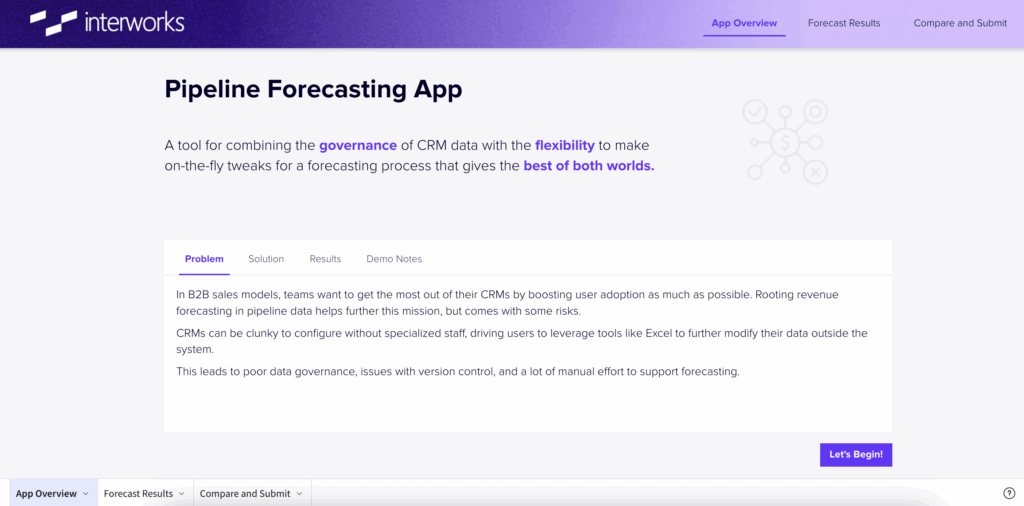
Above: A view of the home page from the forecasting app.
The App in Action
For this walkthrough, imagine it’s late 2025 and we’re planning for Q1 2026.
Starting Point: The Overview Dashboard
We start with a dashboard comparing forecasts to revenue targets by product, geography and month. Think of it as the Power BI or Tableau “at-a-glance” view. In a traditional dashboard environment, our options from here are essentially to further visualize the same information in ever more insightful ways. We can do the best possible work in discovery and scoping to build exactly what stakeholders want to see, but rarely can we solve an entire problem. Building a dashboard is often serving the purpose of filling one step in a bigger process. Teams need data to fulfill other needs — in this case to produce a forecast.
So rather than push users back to data sources to make changes, or try to configure clunky parameters in Power BI, this app invites users to stay here and edit their forecast in Sigma with two distinct paths.
Path 1: Opportunity-Level Adjustments
For this app, I created two primary methods for adjusting results to create a forecast. The first is to edit which opportunities are included.
Organizations typically structure opportunities at a project-level, which theoretically should capture potential (or actual) revenue. By pulling in opportunities in certain stages, probabilities or some other combination of business rules, a forecast can be built that is derived from real sales data. In practice, it is difficult for teams to keep this data up to date and accurate: Duplicates occur, stages don’t get updated in time and the finance team may have hard deadlines on forecasting. Any of these little hygiene issues can cause all sorts of issues.
In this app, I allow for a simple override of which opportunities are included or excluded to solve the issue in a basic way. However, in a more advanced deployment, you can imagine going as far as updating dates, amounts or really anything just as you would in Excel. Deciding how far to go here would be to balance maintaining Salesforce as a source of truth with ultimate forecasting flexibility. For this app, the edits are fairly limited as include or exclude.
Path 2: Batch Adjustments with Built-In Governance
For bigger, faster, even more flexible changes, this app allow users to make batch adjustments at a higher level of grain than opportunities. This would be for cases where management wants to account for some broader risk they cannot tie to a specific project, or possibly include revenue they do not see in the CRM.
Users fill out a form to indicate a month, geography, product and amount for batch adjustments. If they leave any of these blank, the app will stop them from completing the entry and guide them to fill the requisite forms. This is a great example of how Sigma allows for user flexibility, while introducing governance measures to maintain data quality. In Excel, that kind of mistake might lead to manual cleanup later. Here, built-in governance prevents it in the first place.
Creating and Comparing Scenarios
While making these edits, users also get instant visual feedback throughout the app. This real-time interaction powers fun visualizations to compare their edits against the CRM Baseline starting point, and further compare multiple versions simultaneously.
Once users have made adjustments, they can save their versions and begin analyzing various scenarios. These scenario views make it easy to test different forecast outcomes and KPI impacts.
The user is prompted to “Create New Version,” select a name, add notes and load that version as a new scenario. In Sigma, each click can trigger complex multi-step actions — for example, creating a new version might trigger 60+ automated steps like data appending, loading indicators and navigation updates, all wrapped into one smooth experience. This is a major upgrade from native Power BI buttons which are 1:1 with clicks and actions within standard reporting, and surprisingly intuitive to configure.
Submitting Final Forecasts
When ready, users can review all the versions they (and others collaborators) have produced to flag which versions are submission-ready. These get pushed into a consolidated “Submitted Forecast Versions” table that is cleanly grouped to the specs finance needs.
Here comes the game changer: Through Sigma’s native write-back functionality to Snowflake, the forecast versions selected to submit almost instantly appear in the data warehouse in a materialized view. (Side note: Configuring this write-back took about five seconds with three clicks).
This means Sigma becomes not just a forecasting environment, but a collaborative data entry and modeling surface feeding the entire analytics ecosystem.
Who Benefits
- Sales teams: Spend less time in Excel and more time selling.
- Executives: Get instant visibility into forecasts — no manual consolidation required.
- Analysts: Eliminate the headaches of cleaning up multiple spreadsheets.
- Finance teams: Use this same structure for FP&A or P&L scenario planning.
I also think this type of app makes Sigma fit beautifully into existing tech stacks. Maybe your finance org is still heavily reliant on Power BI or Tableau for their reporting suite, and is not quite ready to migrate. Layering a Sigma app into a workflow like this plays nicely with those tools because of the materialization of output into your data warehouse. You don’t need to rip out Power BI or Tableau right away. You can layer Sigma on top of your data warehouse to add flexibility and interactivity where users need it most.
Final Thoughts
This project took about two weeks of part-time work which felt surprisingly quick for my first Sigma build. The low barrier to entry and powerful write-back functionality make it ideal for agile forecasting or any use case requiring both governance and flexibility.
Sigma is about extending your BI tools, not just replacing them, by giving users a hands-on, Excel-like experience while keeping everything tied to governed data in your warehouse.
For organizations juggling multiple BI platforms, that’s a serious win.