Speed is of the essence in lots of things, and Tableau dashboards are no different. Developers and end users alike want dashboards loaded in a blink of an eye. Luckily, there are many resources online that will help you optimise your dashboards, such as optimising calculations, taking extracts and limiting the data and worksheets to what is necessary without affecting the insight you are providing.
However, there are times when these optimising solution still don’t yield the result you need. Your underlying data contains many millions or even billions of datapoints, brought together using complex SQL queries in database views or direct Custom SQL in Tableau. Extracts may be unsuitable due to the sheer volume and complexity of the data – it’s very time consuming to generate that extract locally, and too resource intensive to have applying a daily refresh schedule on Tableau Server.
With billions of datapoints, it’s likely that your data is clearly segmented — for example, by country, product or something like that. When you filter the data on one of these fields, the number of data points reduces dramatically. However, you cannot create extracts based on these fields as users want to be able to select different countries or products. Just using them as quick filters won’t work, as every filter change will take minutes, even for properly indexed tables.
But what if I told you that you could pre-filter this massive data source using these segment fields? You can pass parameter values into Custom SQL queries in where clauses, or use them via data source filters. You can pre-populate your parameters if they are static and want to limit it to single select only, or you can use a separate data source with the distinct (combination of) values for these segment filters and build a landing page around this before you load your main, massive data source.
There are a couple of questions you need to ask of the data and pre-filters:
- Do you have one or more pre-filter fields?
- If you have more than one, do you want to ensure you can only select relevant values for your pre-filters (e.g. when you select a country, only relevant regions are still visible in another filter)?
- Do you expect the values in the pre-filter dimensions to change often, or are they static lists?
- Do you want to pass multiple values per pre-filter, or only one?
- Does it include filtering on a Date dimension?
The complexity of the solution is dependent on these answers but the gain in performance can be significant.
There are two elements to consider, the parameter logic and the filtering logic. Let’s tackle parameters first.
Static List Parameters
The simplest solution would be parameters with a static list of values, using only one value per pre-filter dimension to filter your main data source. This works great if the pre-filter values do not change and you either have only one pre-filter or if you have more than one, you do not require the additional filter(s) to show only relevant filter values.
In our example we want to pre-filter a view or custom SQL query on [Country], [Segment], and [Date]. [Country] and [Segment] are independent of each other, the values for both dimensions are static, and we want the user to select one or all values per filter.
Start by setting up four parameters: [Country Parameter], [Segment Parameter], [Start Date] and [End Date]. Populate both the [Country Parameter] and [Segment Parameter] by adding the values from the (for now unfiltered) main data source using a Fixed list option. We also add two additional options “(All)” and “(None)” to both these parameters.
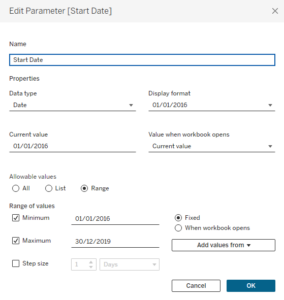
The [Start Date] and [End Date] parameters could potentially be limited to the minimum and maximum [Date] in our main data source, but only based on hard coded fixed dates, as otherwise, we still need to somehow load the main data source to figure out the domain of the [Date] field. 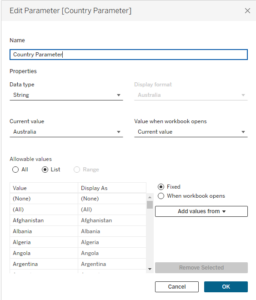
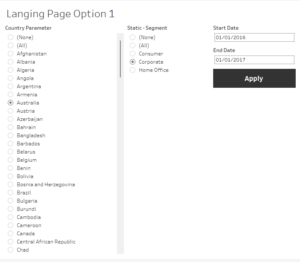
Finally, we add all these parameters to an empty dashboard (using the Analysis menu). On this dashboard, we can set the parameter values and add a navigation button (here shown as an Apply button) which takes the user to the main dashboard. We still need to apply the parameter values to our main data source, for which I will explain the two possible methods later.
Dynamic Parameters
The more complex solution would involve a separate data source containing the permitted values for each parameter and potentially the relationship between the parameters – for example, if the user can select one or more Countries and then Regions or Cities, you want the options you can select to be dependent on each other.
If the relationship between the filters is not important, you could also have a data source for every list of filter values. This might be even more performant as you only have distinct lists of values instead of every combination of values.
Both scenarios do enable you to be far more dynamic than the static list option, as the underlying values can be automatically updated as well and it will enable you to create multi value selections.
Let’s create a separate data source that contains a subsection of our main data source – a distinct list of [Market] and [Country]. Depending on the backend, the query would be similar to this:
Select distinct “Market”, “Country” from “SuperStore”
We would like these two dimensions shown as normal filters on a dashboard, together with an Apply button, which will pass the selected values as a concatenated list to a parameter, and a Reset button, which will either reset the filters to blank or select all values by default. Date filtering will still be done using standard date parameters.
The filters need to originate from a worksheet built from this new data source. So, let’s start by building two worksheets — one to act as Apply button and one to act as Reset button. We want the Reset button to blank the filters instead of selecting all values, to ensure the main data source is never loaded with all values selected. This only works if we have two action filters originating from the Reset button that apply an “empty field” to both [Market] and [Country] on the Apply button worksheet. This will add the action filters to the Apply button worksheet, which in turns enables us to show which items are selected in each action filter on a dashboard and allow the user to add or remove items.
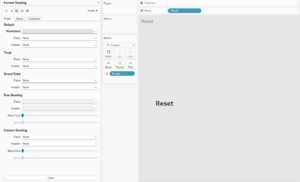
Therefore we start with the Reset button to trigger the creation of the Action filters. We open a blank worksheet and using the new data source, we create a field called [Empty] which only contains two quotation marks (single or double). We drop this field onto detail, add an ad-hoc “Reset” label to the Row shelf and change the mark type to Polygon. We can change the background colour of the whole worksheet to grey and make the “Reset” label a bit bigger. Bear in mind that we need the “Reset” label on the Row (or Column) shelf, as a Polygon mark cannot have a label of its own.
We now duplicate this worksheet and change the label from “Reset” to “Apply” and add both the [Market] and [Country] fields to detail as well. The reason to go for Polygon is that there is no visible mark that gets multiplied by the combinations of [Market] and [Country] selected. You can use another mark type, but when multiple values are selected you need to find a way to concatenate these all into a single mark to prevent having many “Apply” buttons. Please note, we don’t add [Market] and [Country] to the filter shelf, as we want to do this by creating and triggering the action filters from the Reset button to the Apply button.
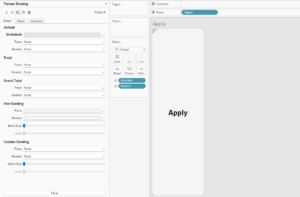
Next, we add the Apply and Reset button sheets onto a new empty dashboard, let’s call it Landing Page, and create the filters.
Create two filter actions from the Reset button sheet to the Apply button sheet for every individual field ([Market] and [Country] in our case), having the [Empty] field as Source and [Country]/[Market] as Target field, run action on Select and “Keep filtered values” after clearing the selection:
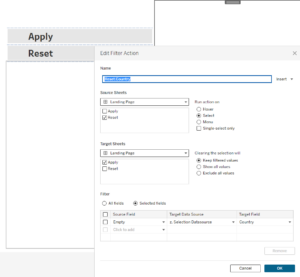
As soon as we hit the Reset button, the action filters are created on the Apply button worksheet and both will be empty, so the Apply button disappears for now. Add both Action filter cards to the dashboard and change the [Country] filter card to show Relevant values relative to the [Market] only if you want. Now that the filters act on the Apply button, the only thing left is passing the selected values into parameters:
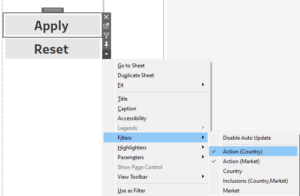
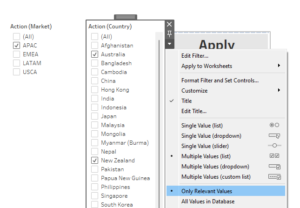
Let’s create two further parameters called [CountrySQL] and [MarketSQL] as free-text string parameters. For testing purposes only, we will make those parameters themselves visible on our Landing Page dashboard. We don’t need to make them visible, but it will help with initial validation.
We than add two new parameter actions from the Apply button that will add the values of [Country] and [Market] to the [CountrySQL] and [MarketSQL] parameters with a Concatenate aggregation.
Ensure the “clearing the selection will” option is set to “keep the current value.” Add two more parameter actions from the Reset button this time, applying the [Empty] field to the [CountrySQL] and [MarketSQL] parameters when the Reset button is clicked:
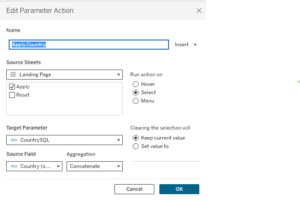
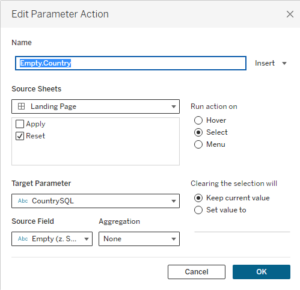
Finally, add the [Start Date] and [End Date] parameters to the dashboard as well as well.
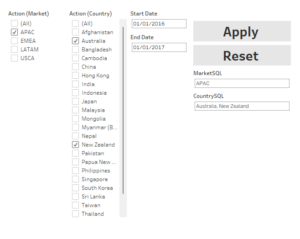
Ensure you have one or two Market and relevant Countries selected in the filters and click the Apply button. The values should be passed into the parameters as a comma-separated list:
 Commas or Other Funny Characters
When using the concatenate aggregation for a parameter action, the delimiter will always be a comma. If the filter items contain commas already, the easiest thing to do is replace the existing commas in the values with another character using a calculated field. However, in some instances you might encounter multiple characters that might be interpreted as delimiters or cause other issues in the underlying data. In that case, you could wrap the dimension you want to add (concatenated) to the parameter in quotes.
In our example, let’s assume that we have Country names with commas (e.g. “Netherlands, the”). Just add a simple calculation called [CountryQuoted] which wraps all the values in double quotes by using this formula:
‘”’+[Country]+’”’
Where you currently have [Country] on detail and within parameter actions, replace with this [CountryQuoted] field.
Applying the Parameters to the Data Source
There are two ways of applying the parameters to the data source.
- Add data source filters to your main data source
- Add the parameters into a custom SQL query’s where clause
Whilst option 1 is a lot easier, especially if you have a multi-value parameter with a concatenated list of values, option 2 can be a lot more performant. This might not always be the case, so I recommend testing it yourself.
For option 1, you can either add Conditional filter on [Country], [Market] and [Date] using a logic like
([CountrySQL] = ‘(All)’ ANDtrue) OR (CONTAINS([CountrySQL],[Country]))
AND
[Date] >= [Start Date] AND [Date] < [End Date]
Or we can put this into three separate boolean fields and add those fields set to true to the data source filters, which is essentially doing the same thing:
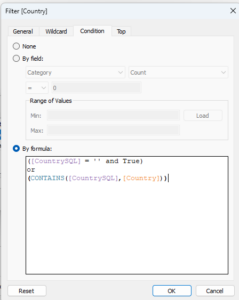
Option 2 is a bit more involved. First of all, if we connect directly to a table or view, we need to convert this to Custom SQL first. If we only have single value parameters, we can add the following where clause to the end of our Custom SQL query (here is the Snowflake dialect, but this should be the same or similar in other SQL dialects).
Where "Order Date" between <Parameters.Start Date> and <Parameters.End Date>
And (
    (<Parameters.Country Parameter>= 'X' and false)    or
    (<Parameters.Country Parameter> = '(All)' and true)    or
    (<Parameters.Country Parameter> =  "Country")
)
And (
    (<Parameters.Segment Parameter> = 'X' and false)    or
    (<Parameters.Segment Parameter> = '(All)' and true)    or
    (<Parameters.Segment Parameter> =  "Segment")
)
However, if we have multiselect parameters, it becomes a bit more involved.
In Snowflake, we can use the combination of functions TABLE and SPLIT_TO_TABLE function to split a concatenated string into its individual values as rows. In Microsoft SQL Server (2016+), the equivalent function is STRING_SPLIT.
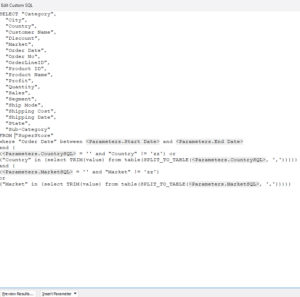
In Snowflake, the SPLIT_TO_TABLE function changes the concatenated string to table format, and the TABLE function ensures we can then query that list like it is any other table or view:
where "Order Date" between <Parameters.Start Date> and <Parameters.End Date>
and (
(<Parameters.CountrySQL> = '' and "Country" != 'zz') or
("Country" in (select TRIM(value) from table(SPLIT_TO_TABLE(<Parameters.CountrySQL>, ',')))))
and (
(<Parameters.MarketSQL> = '' and "Market" != 'zz')
or
("Market" in (select TRIM(value) from table(SPLIT_TO_TABLE(<Parameters.MarketSQL>, ',')))))
In Microsoft SQL Server, the SPLIT_SPLIT function does both in one go:
where "Order Date" between <Parameters.Start Date> and <Parameters.End Date>
and (
(<Parameters.CountrySQL> = '' and "Country" != 'zz') or
("Country" in (select TRIM(value) from STRING_SPLIT(<Parameters.CountrySQL>, ','))))
and (
(<Parameters.MarketSQL> = '' and "Market" != 'zz')
or
("Market" in (select TRIM(value) from STRING_SPLIT(<Parameters.MarketSQL>, ','))))
Bear in mind that if you wrapped the individual values in your concatenated parameters in quotes, you would have to remove those like this:
("Field" in (select REPLACE(TRIM(value),’”’,’’) from table(SPLIT_TO_TABLE…/STRING_SPLIT….
Final Steps
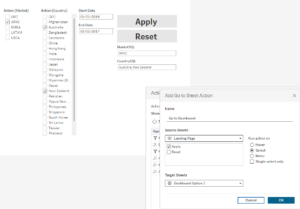
Since the Apply button pushes the (comma-separated) values straight into the parameters referenced in the Custom SQL query, the filtering happens straight away. The only thing that we might want to add, is either a navigation action on the same Apply button to the first dashboard that uses the main, now pre-filtered, data source or a separate navigation button underneath the Apply button. We will go for the first option.
We should also rename the filters to remove the Action bit, and remove the parameters themselves, which we only left on the landing page to check if action from the Apply button actually works:
And that should be it! If you have any questions, or if you’d like to work with us on your Tableau/SQL projects, drop us a line!

