
During the summer between 6th and 7th grade, my best friend Paul and I walked to the Piggly Wiggly across from the street from my house, and we each impulse purchased our first pack of baseball trading cards. I was immediately hooked! Many more packs (and boxes) followed, and I spent the rest of the summer memorizing the stats on the back of my favorite players’ cards and learning what an ERA, AB and RBI were. As I grew up in South Dakota, our adopted home team was the Minnesota Twins, and that fall in 1987, Kirby Puckett, Gary Gaetti and Kent “Buy a Vowel” Hrbek led the Twins to the American League Championship and to the World Series against the St. Louis Cardinals.
The World Series
Currently, the team with the better regular season record is granted home field advantage in the World Series. Prior to the 2003 baseball season, however, the American and National league alternated this benefit. In 1987, it was the American League’s turn, and, as AL champions, the Twins would be that season’s benefactor. As an aspiring stats nerd, however, something about this advantage bothered me. Let me explain…
First, for the sake of simplification, let’s establish some notation. To make a distinction about home field advantage in the World Series and the advantage enjoyed by a team playing an individual game at home, I’ll refer to World Series home field advantage as WSHFA and single-game home field advantage as GHFA. The team with the WSHFA will be referenced as Team A and the team that does not have this benefit will be Team B.
By inheriting (or earning) WSHFA, Team A plays the first two games of the series on their home field. The next two games are played at Team B’s. The series is won by the first team to collect four wins. So, if one team wins the first four games, the series is over, and a champion is declared. However, this is rarely the case, and if the series continues to five, six or seven games, game five is played at Team B’s home field, and six and seven are played back at Team A’s. From the perspective of Team A, then, the series structure looks like this:
Home – Home – Away – Away – Away – Home – Home (H-H-A-A-A-H-H).
So, if the series concludes after four games, each team plays two games at home and two on the road. If the series goes to five, Team B enjoys the benefit of playing more games at their home field. If the series goes to six, each team plays three games at home and three on the road. Only if the series goes to seven games does Team A truly receive the benefit of playing more games at home. Because of this, inheriting the WSHFA never seemed terribly beneficial to me. My twelve-year-old self wondered, “What are the chances of the series going to seven games, really? If anything, isn’t it more likely that the series would end after five, giving Team B the greater likelihood of playing more games at home and the real World Series home field advantage?”
All these years later, I set out to definitively answer the following questions:
- Is World Series home field advantage truly an advantage?
- What are the likelihoods of the series going to four, five, six or seven games?
- Given that a series goes to four, five, six or seven games, which team has the advantage, and how great is it?
The Data
This is a revision of a post I put together for my own blog a few years ago. I’ve taken a little bit different approach this time. For my prior write up, I simulated 100 million World Series and used the distribution of these to estimate probabilities. This time, rather than using simulations to estimate likelihoods, I’m using combinatorics to determine their exact values.
Quantifying the true benefit of WSHFA requires a few (admittedly impractical) assumptions. We must assume that the GHFA is identical for both teams and that it remains constant throughout the series. We must also presume that all other factors that influence game outcomes are spread equally between the two teams. Finally, we must assume that the outcome of each game is independent of the outcome of every other.
In all professional sports, for various reasons, the team playing at home has had a slight overall advantage to their opponent. Historically, during the MLB playoffs, the team playing at home has won 54.2% of the time. So, for most of this project, we’ll use 0.542 as our estimate for the GHFA.
Next, we’ll need to consider every possible combination of wins and losses that result in a World Series winner. Fortunately, this is easier than it sounds. Let’s look at a couple of examples. There are only two ways that the series can end after four games: either Team A wins all four games (A-A-A-A), or Team B does (B-B-B-B). There are four ways team A can win in five games: they can lose the first and win the next four (B-A-A-A-A); win the first, lose the second, and win the next three (A-B-A-A-A); win the first and second, lose the third and win the next two (A-A-B-A-A); or they can win the first three, lose the fourth, and win the fifth (A-A-A-B-A). Using similar processes, we can easily find all other permutations that result in five-, six-, and seven- game series.
Our next step is to determine the probability for each of these combinations. For this, we’ll use our estimate of 0.542 for the GHFA. As a simple example, let’s find the probability that Team A wins the series in four games. Since we’ve set the GHFA to 0.542 for all games and have established that the outcome of each game is independent of the others, the probability of Team A winning the first two games at home is given by this equation:
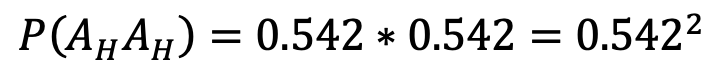
Here, “P” is statistical shorthand for probability, (AH) indicates a win at home for team A, and P(AHAH) is the probability of Team A winning two of two games at home.Now, Team A must win the next two games on the road. Since both teams enjoy a GHFA of .542, the probability of Team A winning a single game on the road is given by:
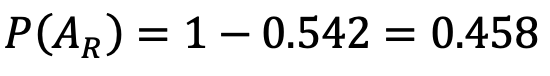
Here, AR indicates a road win for Team A.
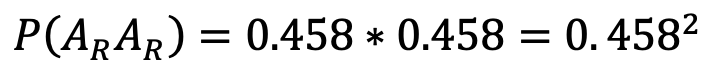
So, the probability of Team A winning games three and four on the road is given by:
And, for the probably of an A-A-A-A outcome, we have:

Using this process along with the statistical software, R, probabilities were determined for every possible series outcome for any GHFA estimate of a precision of one thousandth (0, 0.001, 0.002, …, 0.999, 1). For most of this project, however, we’ll stick to our GHFA estimate of .542. The resulting likelihoods were then used to answer our core questions.
The Results
Question 1: Is home field advantage truly an advantage?
To answer our first question, all we need to do is sum the probabilities of all outcomes that result in a series win for Team A when the GHFA is set to 0.542. So,

Here, the “|” before GFHA is statistical shorthand for “given.”
The results are plotted in the bar chart below:
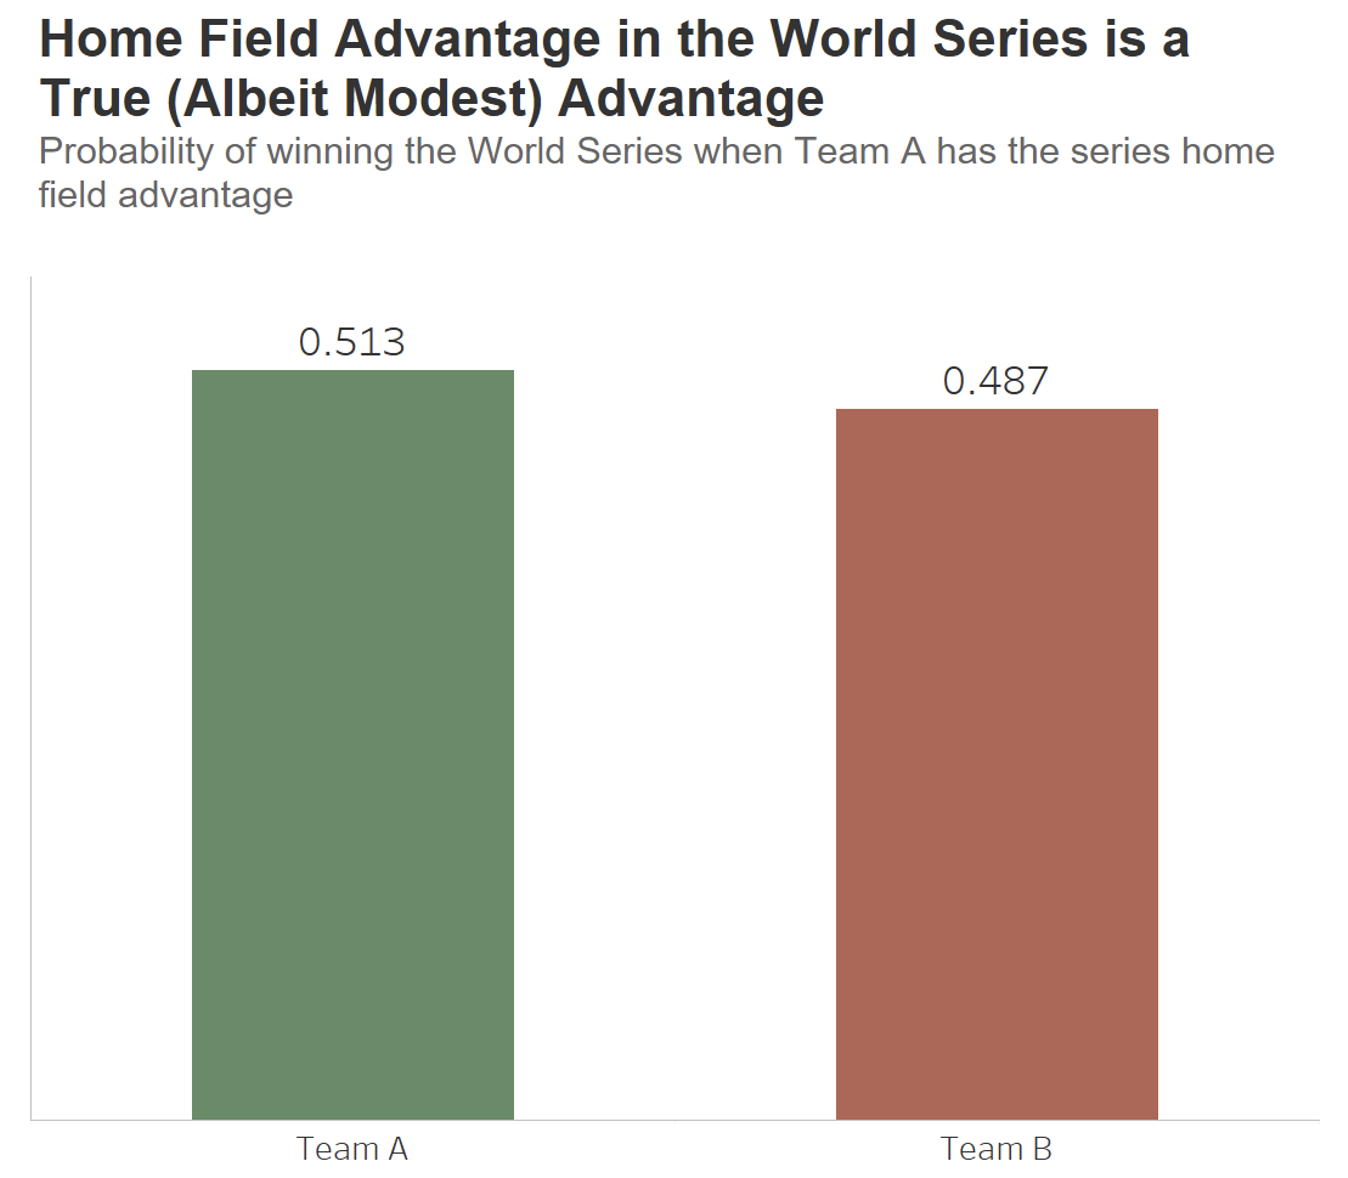
We see that with the GHFA set to 0.542, Team A would have a 0.513 probability of winning the series versus Team B’s probability of 0.487. While only a difference of 0.029 in likelihoods, this does indicate a benefit for the team with the WSHFA.
What happens if we set the GHFA to some value other than 0.542? On the line graph below, GHFA is on the x-axis with a range from 0 to 1. WSHFA is on the y-axis, also with a range from 0 to 1.
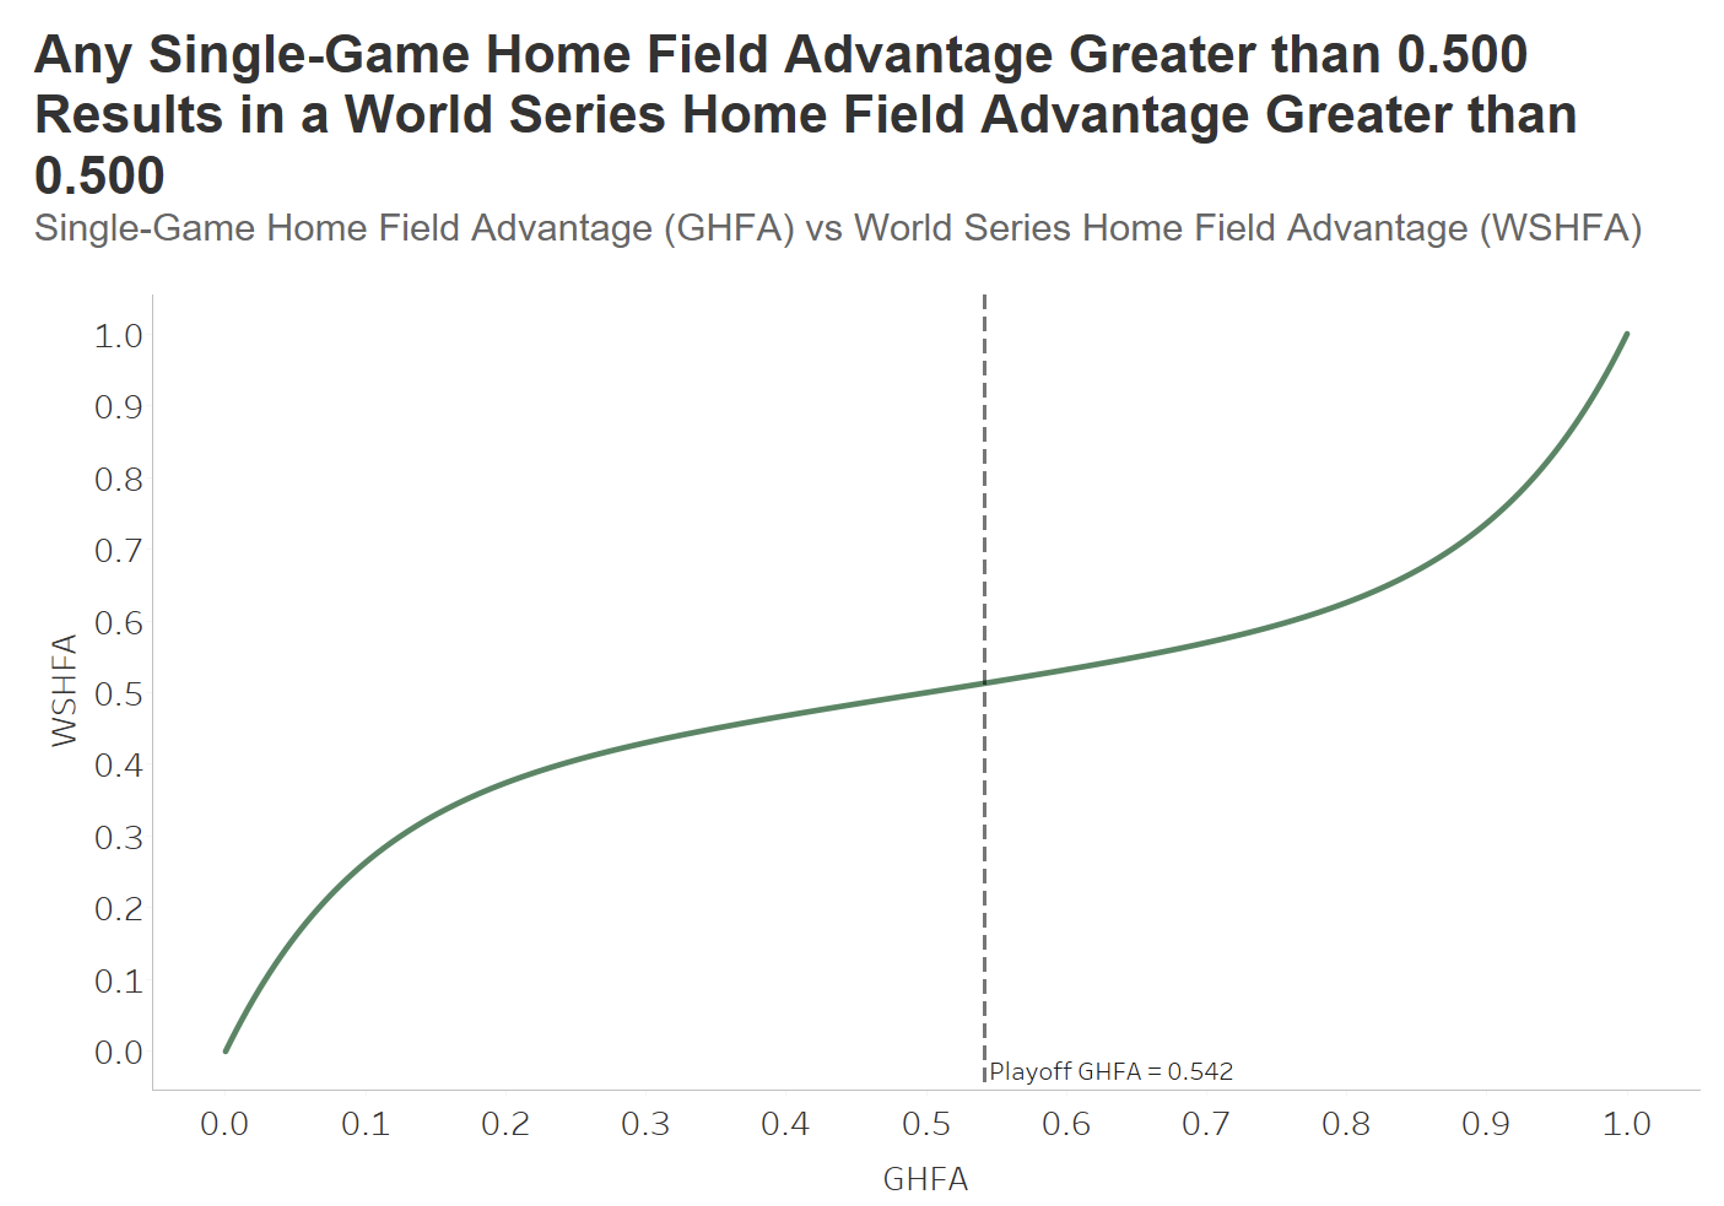
As expected, a GHFA of 0 would result in a WSHFA of 0. This is because, with a GHFA of 0, the outcome all games would be predetermined and would be lost by the team playing at home. Similarly, a GHFA of 1 would result in a WSHFA of 1 as all games would be won by the team playing in their home stadium. We also see that a GHFA of 0.5 results in a WSHFA of 0.5 and that any GHFA greater than 0.5 results in a WSHFA also greater than 0.5.
F(0) = 0
F(0.5) = 0.5
F(1) = 1
And for all GHFA > 0.5
f(GHFA) > 0.5
Question 2: What are the likelihoods of the World Series going to four, five, six or seven games?
To answer our second question, the GHFA was again set to the playoff average of 0.542, and the probabilities of all outcomes that result in the series being completed after four, five, six or seven games (without regard for series winner) were summed. The results are below:
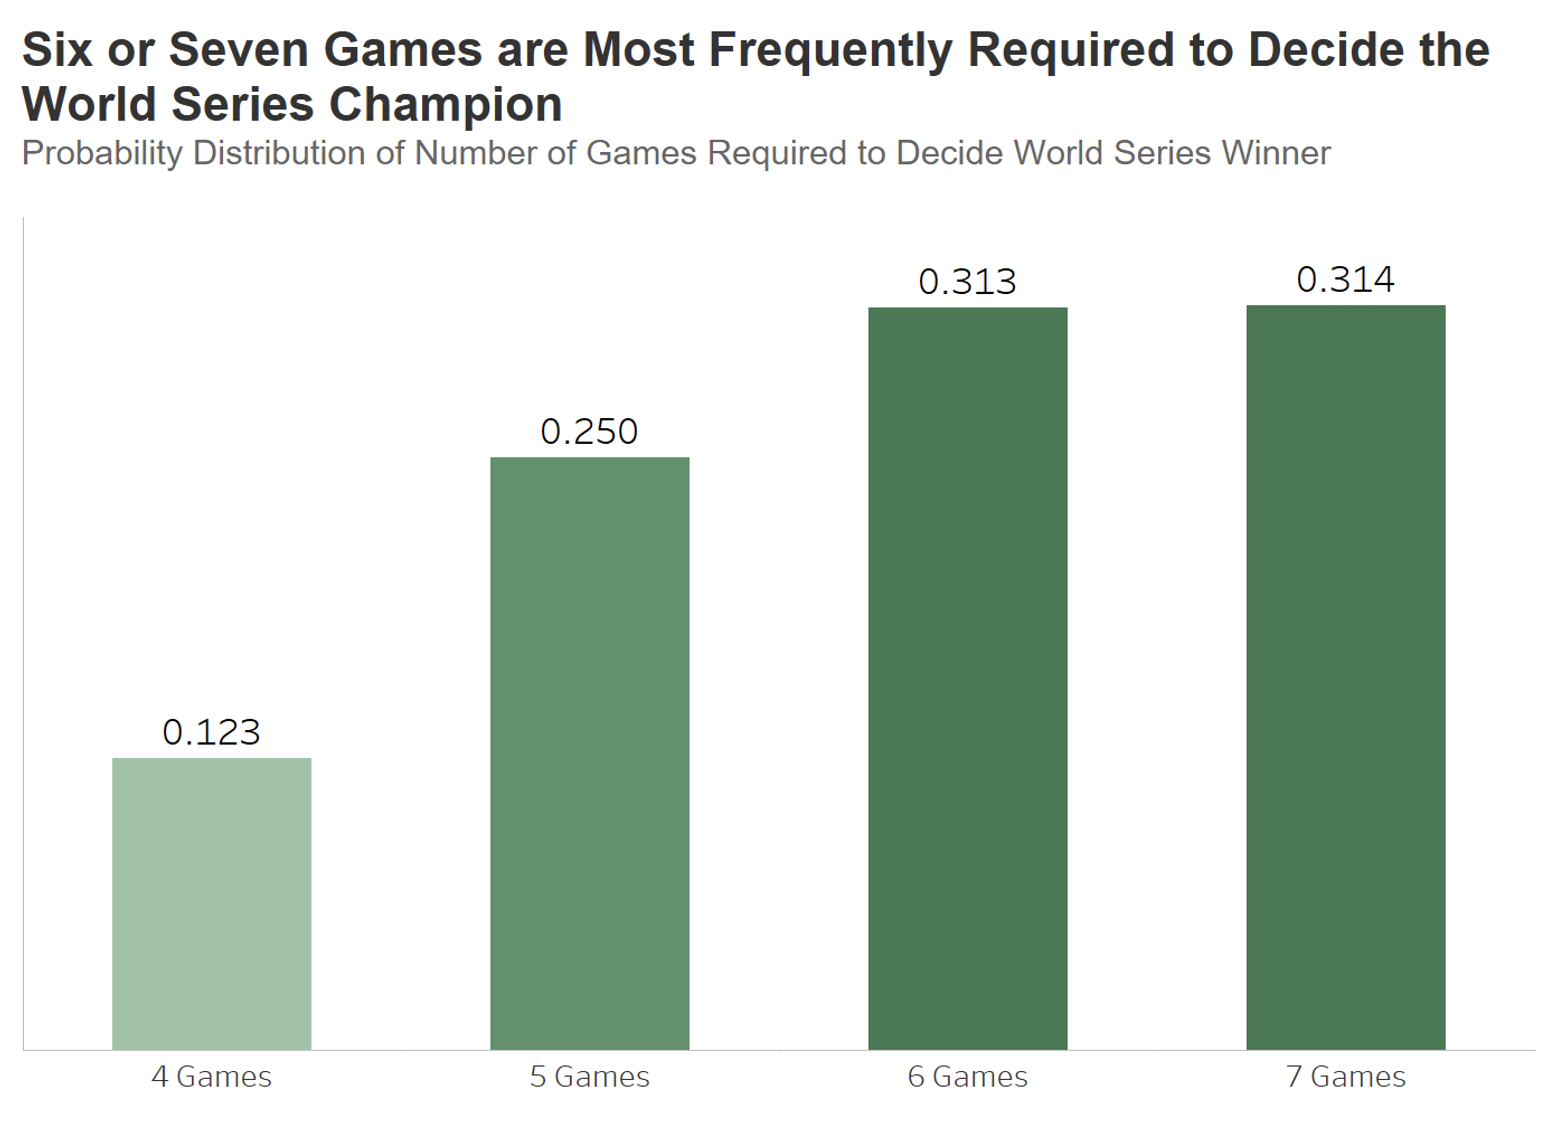
We see that the probability of the series being decided after only four games is 0.123, and the probability of the series requiring five is 0.250. The likelihood of a six-game series is 0.313, and the probability of the series requiring the full seven games is 0.314. Admittedly, this result surprised me. Maybe because sports announcers typically seem so surprised when the World Series (or any seven-game championship series for that matter) goes the full distance, I would not have expected a seven-game series to be the most frequent outcome.
Question 3. Given that a series goes to four, five, six or seven games, which team has the advantage and how great is it?
Answering the final question requires a quick lesson in conditional probability from Statistics 101. To find the probability of some event occurring given some other event has occurred, we find the probability of both events occurring and divide this by the probability of the given event occurring on its own. This is given by:
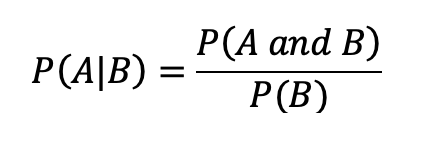
Here, A is some event, B is another and, again, “|” is shorthand for “given.”
So, to determine which team has the advantage given a specified number of games are required to complete the series, we first pick one of our teams (we’ll use Team A) and simply plug our events of interest into the formula above. This results in:

Let’s start with the numerator of the ratio on the right side of the equation. To find the probability that Team A will win in exactly “n” games, we partition all outcomes that result in a series win for Team A by the number of games required and sum the probabilities for each of these groups. For find our numerator, the probability that exactly “n” games are required to complete the series, we can use the same process that was described to answer the second question. We partition all outcomes by the number of required games and sum the likelihoods.
Finally, to find the probability that Team B will win the series given a specified number of games are required, we simply subtract the probability that Team A will win the series for that number of games from 1:

The results are below:
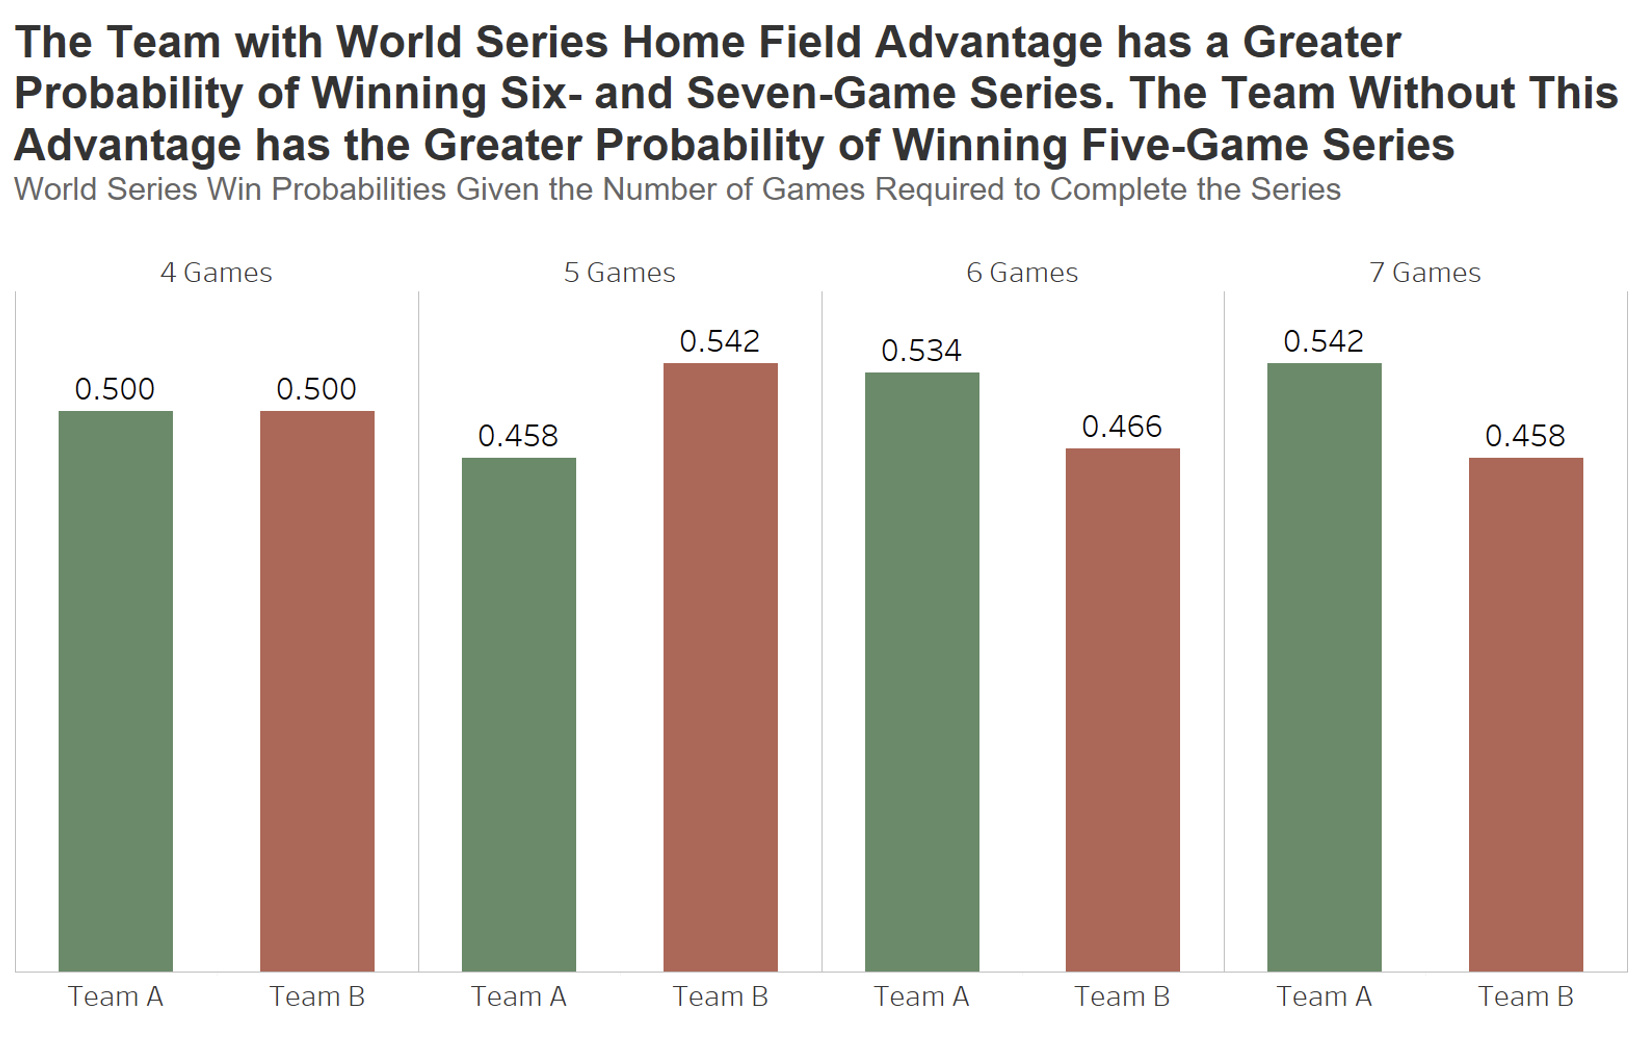
Using our 0.542 estimate for GHFA, we see that each team has an equal probability of winning a four-game series. Team B has a substantially better chance of winning a series that goes to five, Team A has a better chance of winning a six-game series and an even greater advantage when the maximum seven games are required.
In Conclusion
Due to the greater probability of the World Series extending to seven games instead of five, the team with the series home field advantage has the greater probability of playing more games on their home field. As a result, with all other factors being equal, this team inherits a marginally greater likelihood of winning the World Series than does their opponent (0.513 vs 0.487).
Interestingly, the National Basketball Association and National Hockey League follow a different playoff structure than does Major League Baseball. Rather than the two at home, three on the road, two at home (H-H-A-A-A-H-H) format of professional baseball, the NBA and NHL follow a two at home, two on the road, one at home, one on the road, one at home (H-H-A-A-H-A-H) playoff structure. This arrangement guarantees that the team who enters the championships with the series home field advantage will never play fewer games at home than their opponent. I’ll explore the consequences of this format in a future post.
If you have a request for more baseball-related stats, statistics and overall math, (or you want to work with us on your company’s data pipeline) feel free to drop us a line and see what we can do for you!