
Back in my days working in financial planning and analysis (FP&A), my job was rooted in data storytelling. I developed forecasts, ad hoc analyses, models and dashboards to help drive and empower decisions with data. Financial dashboarding, like any other skill, has a learning curve with its own obstacles.
So, How Do You Do Financial Dashboarding?
Whether you are just beginning to build or are trying to revamp your current financial dashboards, here are 5 tips to help you along the way:
1. Expect to Scale
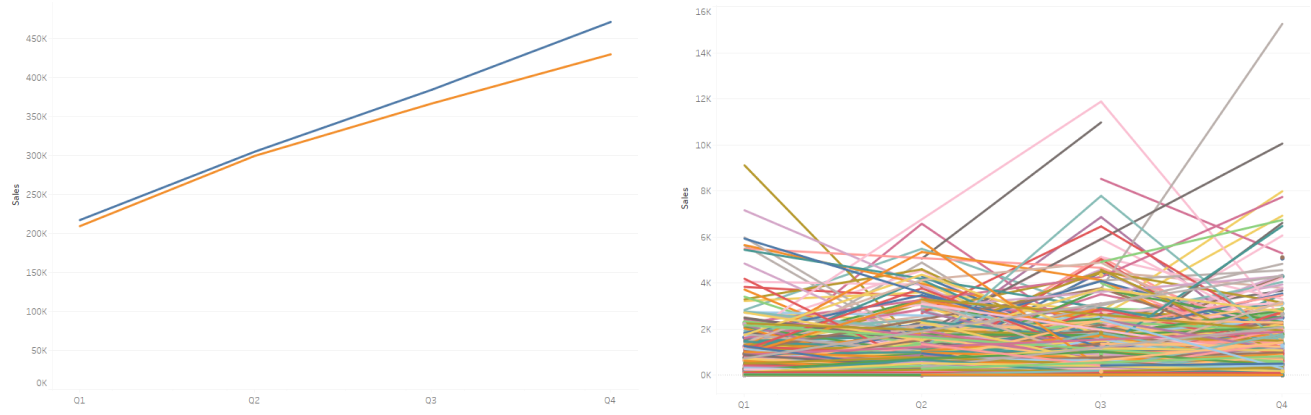
Whenever you are creating a financial dashboard, expect to scale content up and down. As an example: Suppose you released a new product that is performing well. In the coming months, you plan to release a second generation that addresses improvement recommendations from customers. You create a dashboard to track its revenue and include metrics for the first and second generation. Your CFO hears about the dashboard and wants to have the most veteran product included. No problem! Except for the fact that it has 15 generations, and your current dashboard design cannot accommodate the increased number of KPI’s and cardinality (number of models).
Keep in mind that it is really easy to go from the simple, clean graph on the left to the chaotic mess on the right:
2. Define the Purpose, Scope and Use Case
Ask yourself, “Is the dashboard for a report? Is it used to monitor budget? Is the data going to be live?” Ensure the purpose of your dashboard is clear because this can impact design. Imagine a stakeholder asks to create a dashboard that they want to serve as a profit margin report for your firm. One of the requirements is they want to include a breakdown by product. You fulfill their request by building a dashboard that shows profit margin for the firm and include a toggle to select individual products to filter the view. Sounds like a job well done right? Wrong. Your stakeholder comes back and says they needed the report to serve as slides for their quarterly board meeting. They need to show the information in one view or in separate slides but do not want to spend time filtering and exporting a slide for each product. Situations like this can be mitigated if you and your end users clearly define the purpose, scope and use case.
3. Leverage visualization
How many times have you worked on a dashboard and have had the end users request a crosstab? We create visuals because it helps with processing information quickly and effectively. Consider a situation where you are asked to put an indirect cash flow statement into a dashboard. Your user states that they want to use it to get a quick summary of operating, investing and financing cash flow changes. The dashboard is only for internal consumption and will not go into any other reports. You can build the view in a traditional cash flow statement format, but if their purpose is for summary, then there are better options. Consider leveraging pre-attentive properties with a waterfall chart to convey the same information faster and more efficiently.
4. Start Simple
If you are just beginning your dashboard journey, then ease your users into new features and capabilities. Suppose you are introducing a new dashboard to your general managers who historically have used spreadsheets and tables. You would want to transition them to your dashboard by socializing the content. Walk them through the KPIs, metrics and charts on the view then give them time to digest. As they become more comfortable, you can begin introducing new features, drill downs and filters. By gradually introducing the new capabilities, you can prevent them from feeling overwhelmed with too much information and have an easier transition to the new dashboard.
5. Build for Data Backed Discussions (Not Just Decisions)
Imagine that you have built a budget dashboard that shows your users how much available spend they have. You let your users know that the data refreshes daily and is as up to date as possible. They use the information on the dashboard to justify purchasing additional work with a vendor. The issue here is that they may not know how the expense is amortized (spread across the service period) or if there are other plans for the money. Here is where you need to remember and remind your users that even data backed decisions still require discussion, expertise and good judgement.
Putting These Tips Into Action
Below, you can find an example of a dashboard that tackles tips 2, 3, 4 and 5. It serves as a report for a small team and provides information on their budget performance while meeting their requirements of including both a visual and traditional view. The purpose of the dashboard is to facilitate discussion during quarterly reviews and help drive management decisions based on historical expense. If I was expecting to scale it up with higher cardinality, then I would consider other design options like adding Top N filters, GL category filters or a wild card search to high cardinality dimensions. In summary, financial dashboards have their own challenges but if you approach them with these tips in mind you will be able to avoid complications down the road.
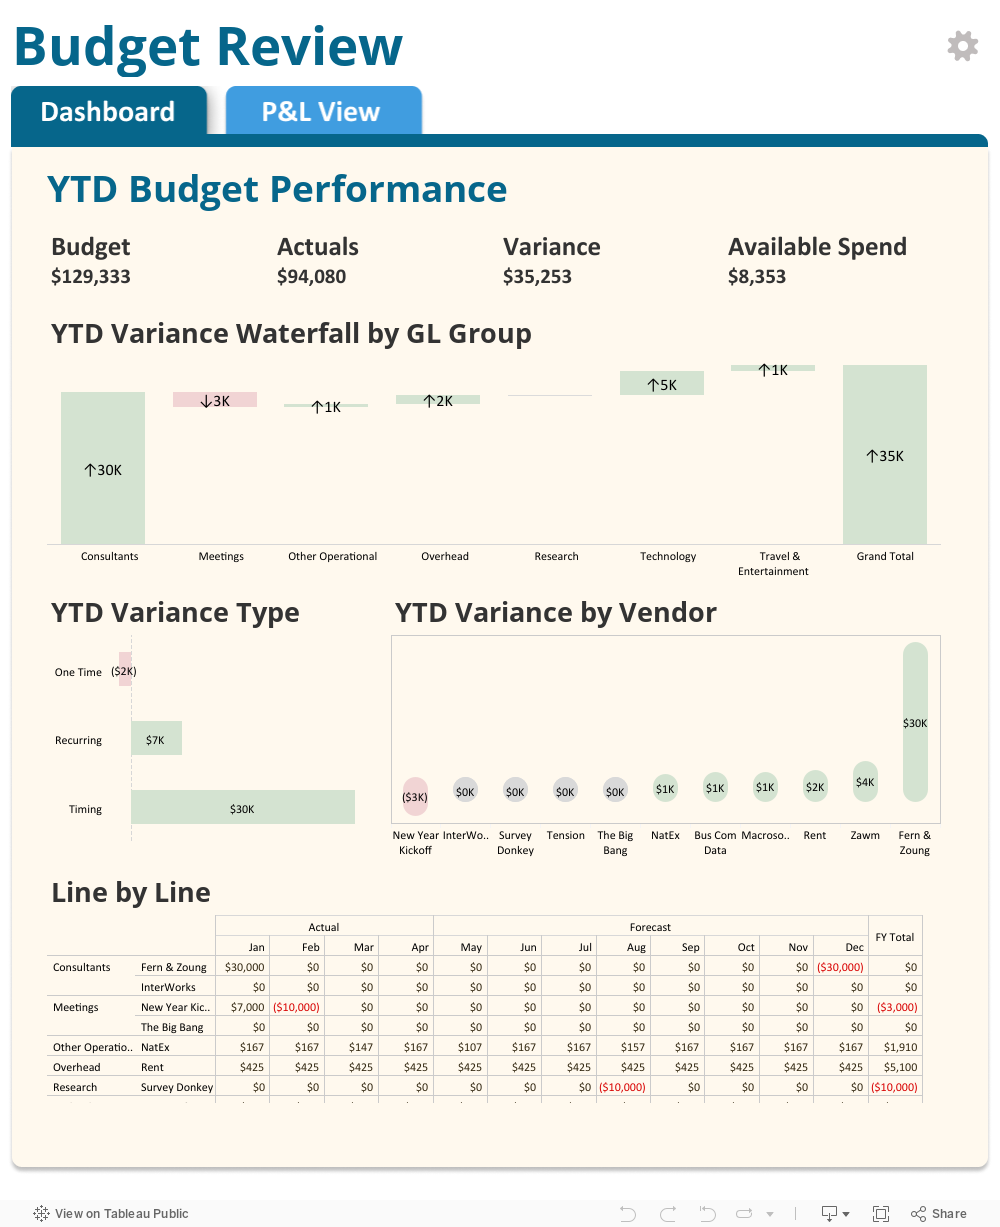
If you’re having issues viewing the dashboard, check it out on Tableau Public here!
Let us know if you want a hand with your financial dashboarding project! We’re always available to help.