
Devs on stage was such a joy to watch this year at Tableau Conference 2023. For those of you unfamiliar with Devs on Stage, this keynote offers an opportunity to hear about exciting innovations from the developers of Tableau themselves. You can watch sessions from Tableau Conference including this keynote for free on Salesforce+.
Here’s a quick recap of the features and changes announced in case you missed them!
Tableau Core & Public
Devs on stage was kicked off by Nicholas Shepherd introducing some new additions to Tableau Public and more.
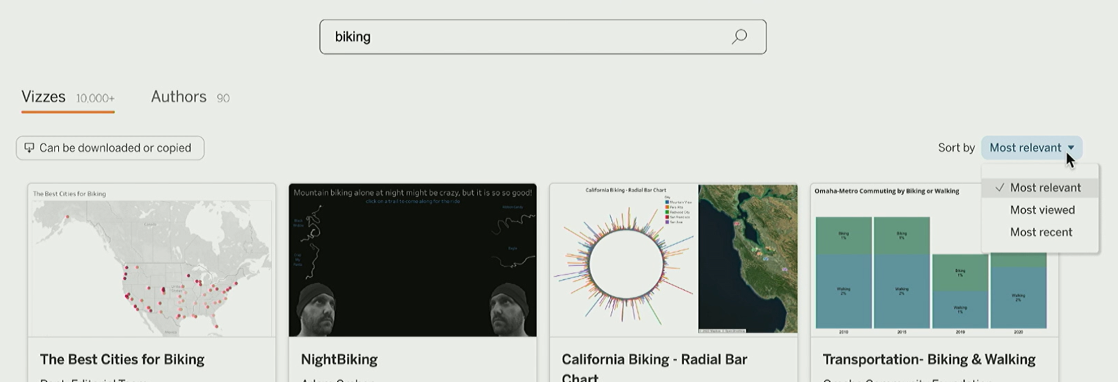
Sorting and Filtering
You can now sort and filter content while searching on Tableau Public by most relevant, most viewed or most recent. You can also filter content by its ability to be downloaded, or authors by their availability to be hired:
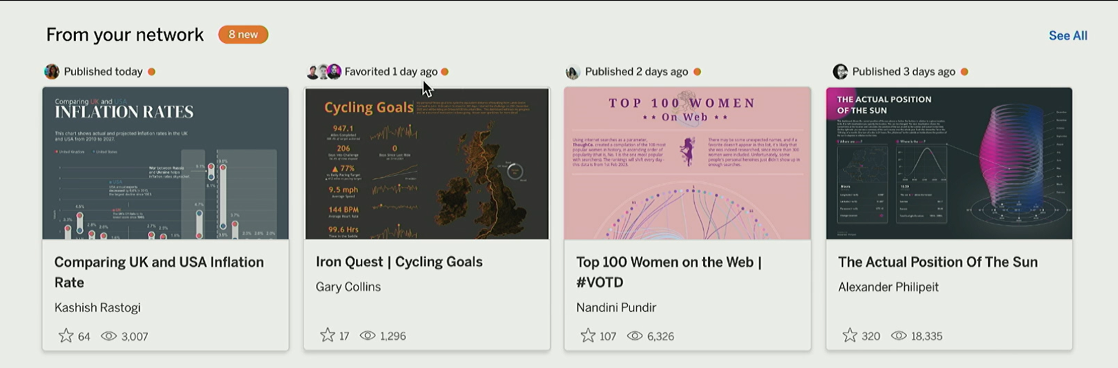
Improved Activity Feed
Added “From your network” section to Tableau Public and notifications helping you stay up to date with authors you have followed:
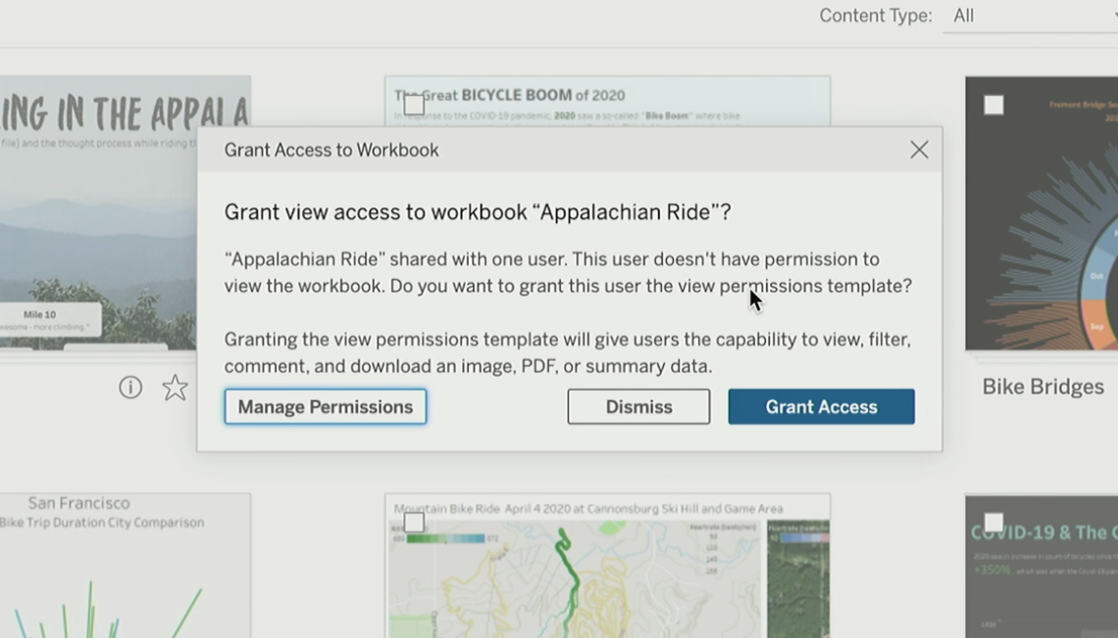
Easily Grant Permissions
Tableau has also added the ability to grant access to content and manage permissions when you share a workbook. This has the potential to be a very convenient time saver and could spare the headache of accidentally sharing something with a user that they can’t access!
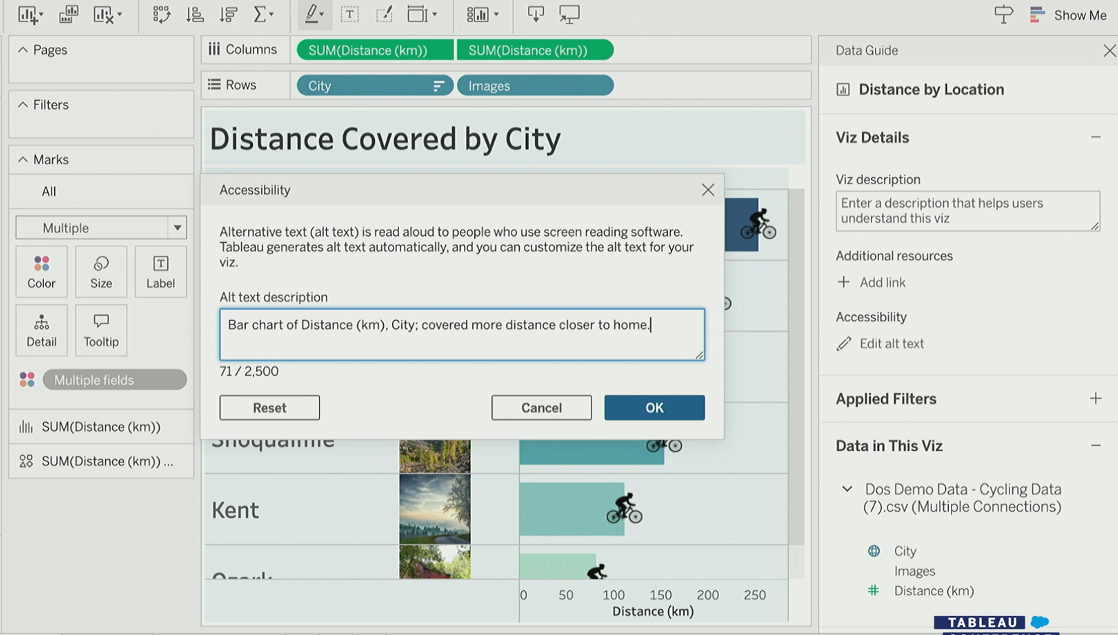
Accessibility Changes
Tableau users now have the ability to edit alt text for better accessibility:
New Image Type Support
Image links no longer require file extensions and Tableau will support larger and different file types including .gif!
Address Geocoding
Users can now turn an address into a geocoded point to visualize on a map without requiring coding or advanced transformations:
New Native Chart Types
Tableau Public will include native Sankey and Radial Charts as a pilot feature for a limited time. Just keep in mind once the pilot ends on June 30, 2023, the ability to create Sankey and radial charts will be removed, as will any associated visualizations created with these features. If you would like to learn more about this new addition to Tableau, take a look at our recent blog post from fellow Interworker Ryan Alexander!
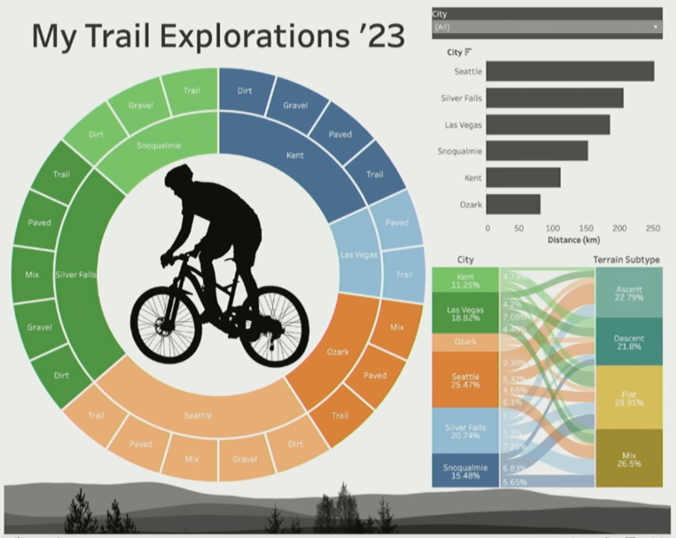
Tableau Prep
Next up, Libby Knell from the Tableau Prep Team shared some new Tableau features related to data prep.
Shared Dimensions
With Tableau’s new Shared Dimension feature you can relate multiple fact tables across multiple shared dimensions to handle more complex data models that may have previously required creating multiple data models or writing complex, analytical SQL. For example, you might have two fact tables, Store Sales and Internet Sales, related to two common dimension tables, Customer and Date without the need to union or transform the Sales Tables:
Tableau Server Administration
Next, Lauren Hampson revealed some new features useful to Tableau Administrators.
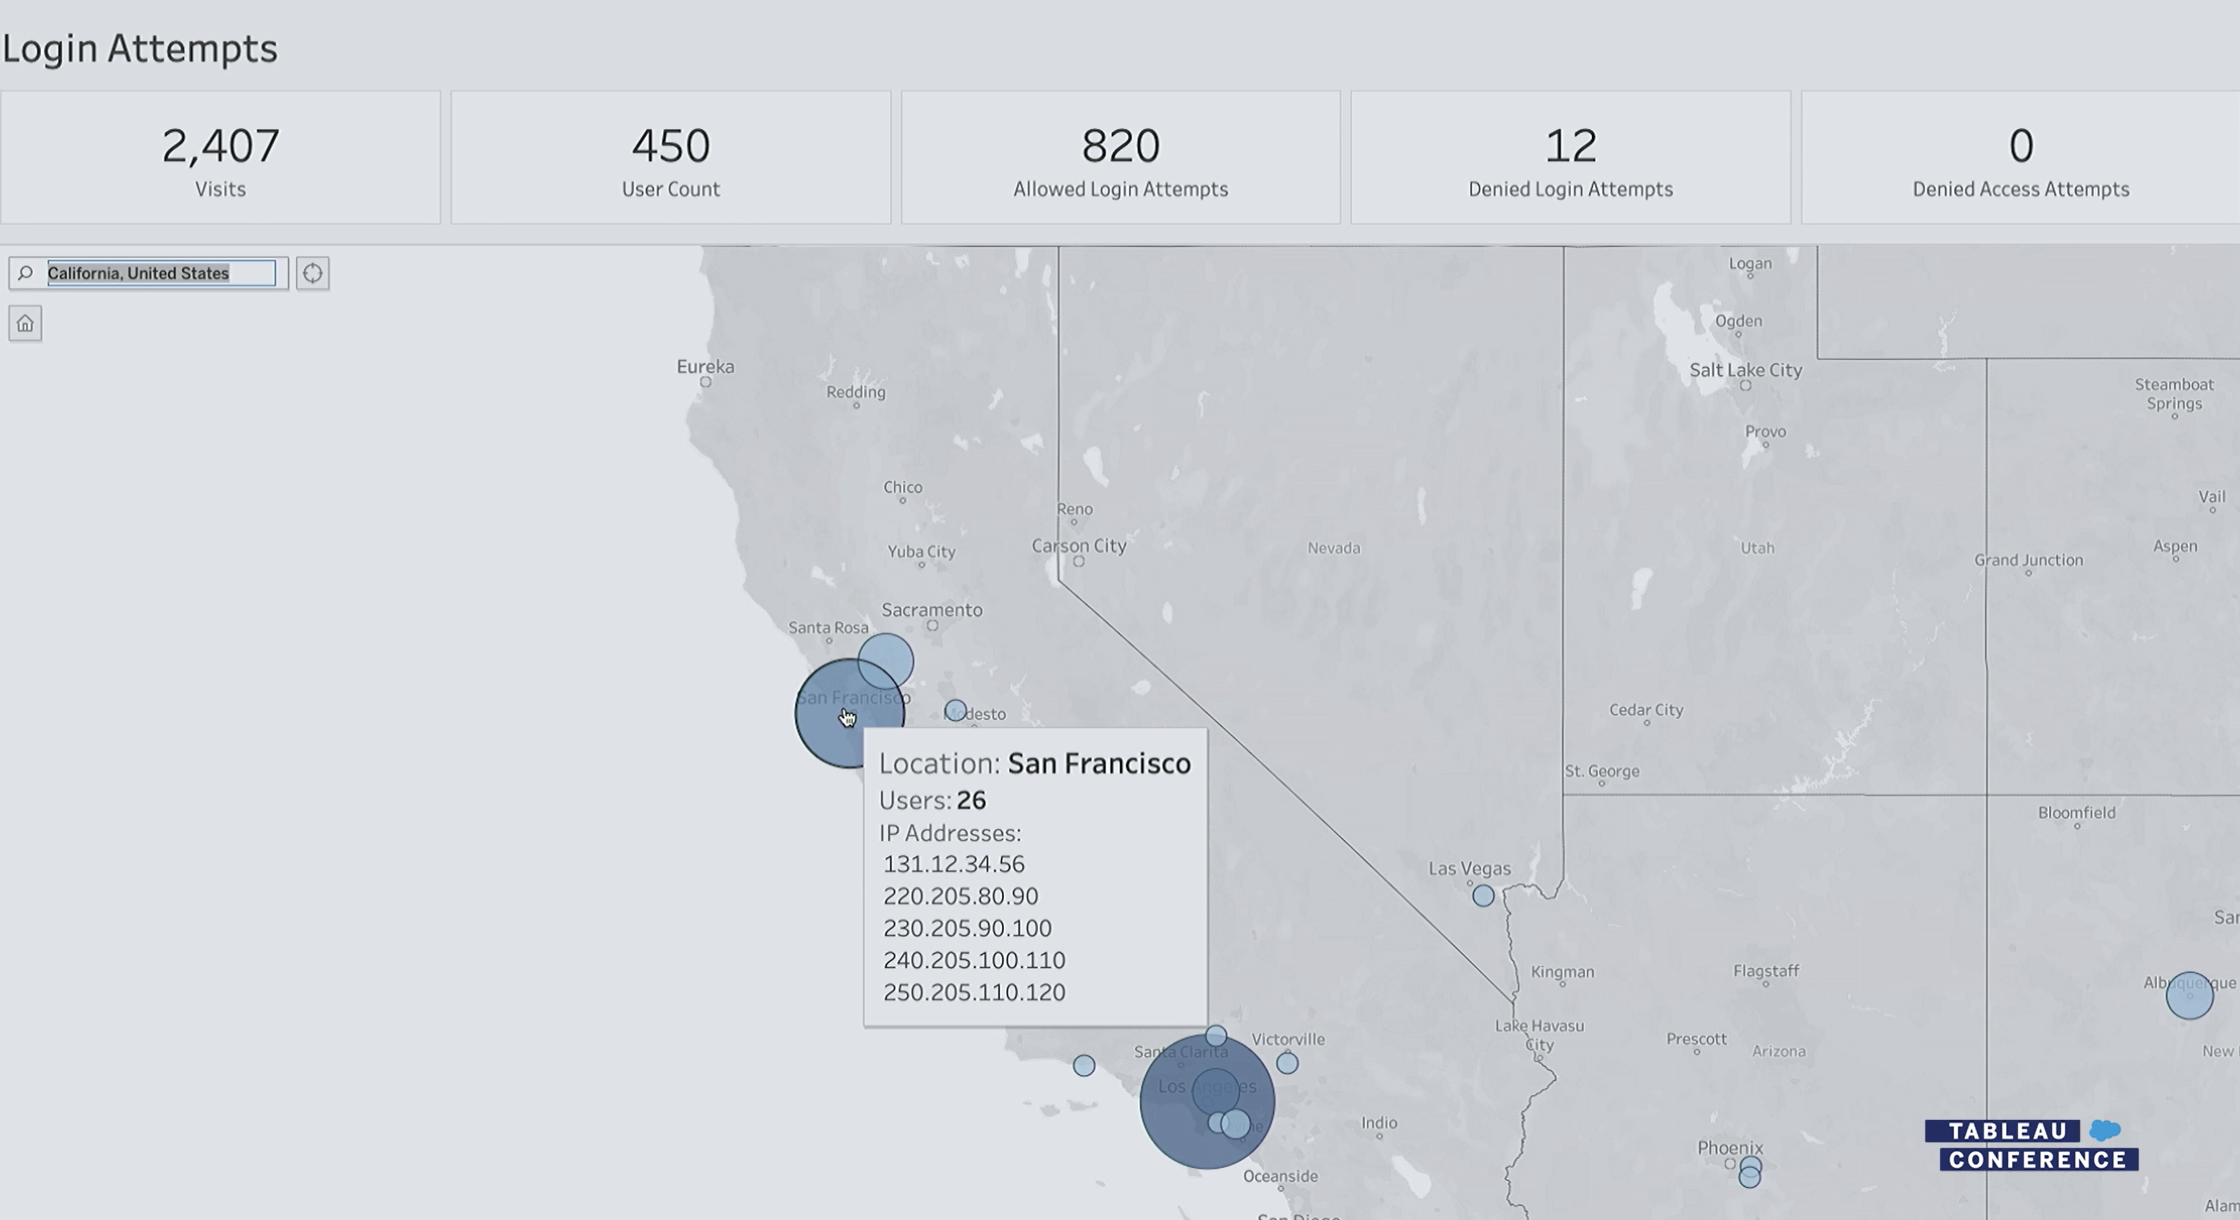
Improved Activity Logs
Admins can now see number of users by location and the location that the users are accessing the site from:
HIPAA Compliance for Healthcare Data
MFA is now mandatory for Tableau Cloud which allows Tableau Online to be fully HIPAA compliant.
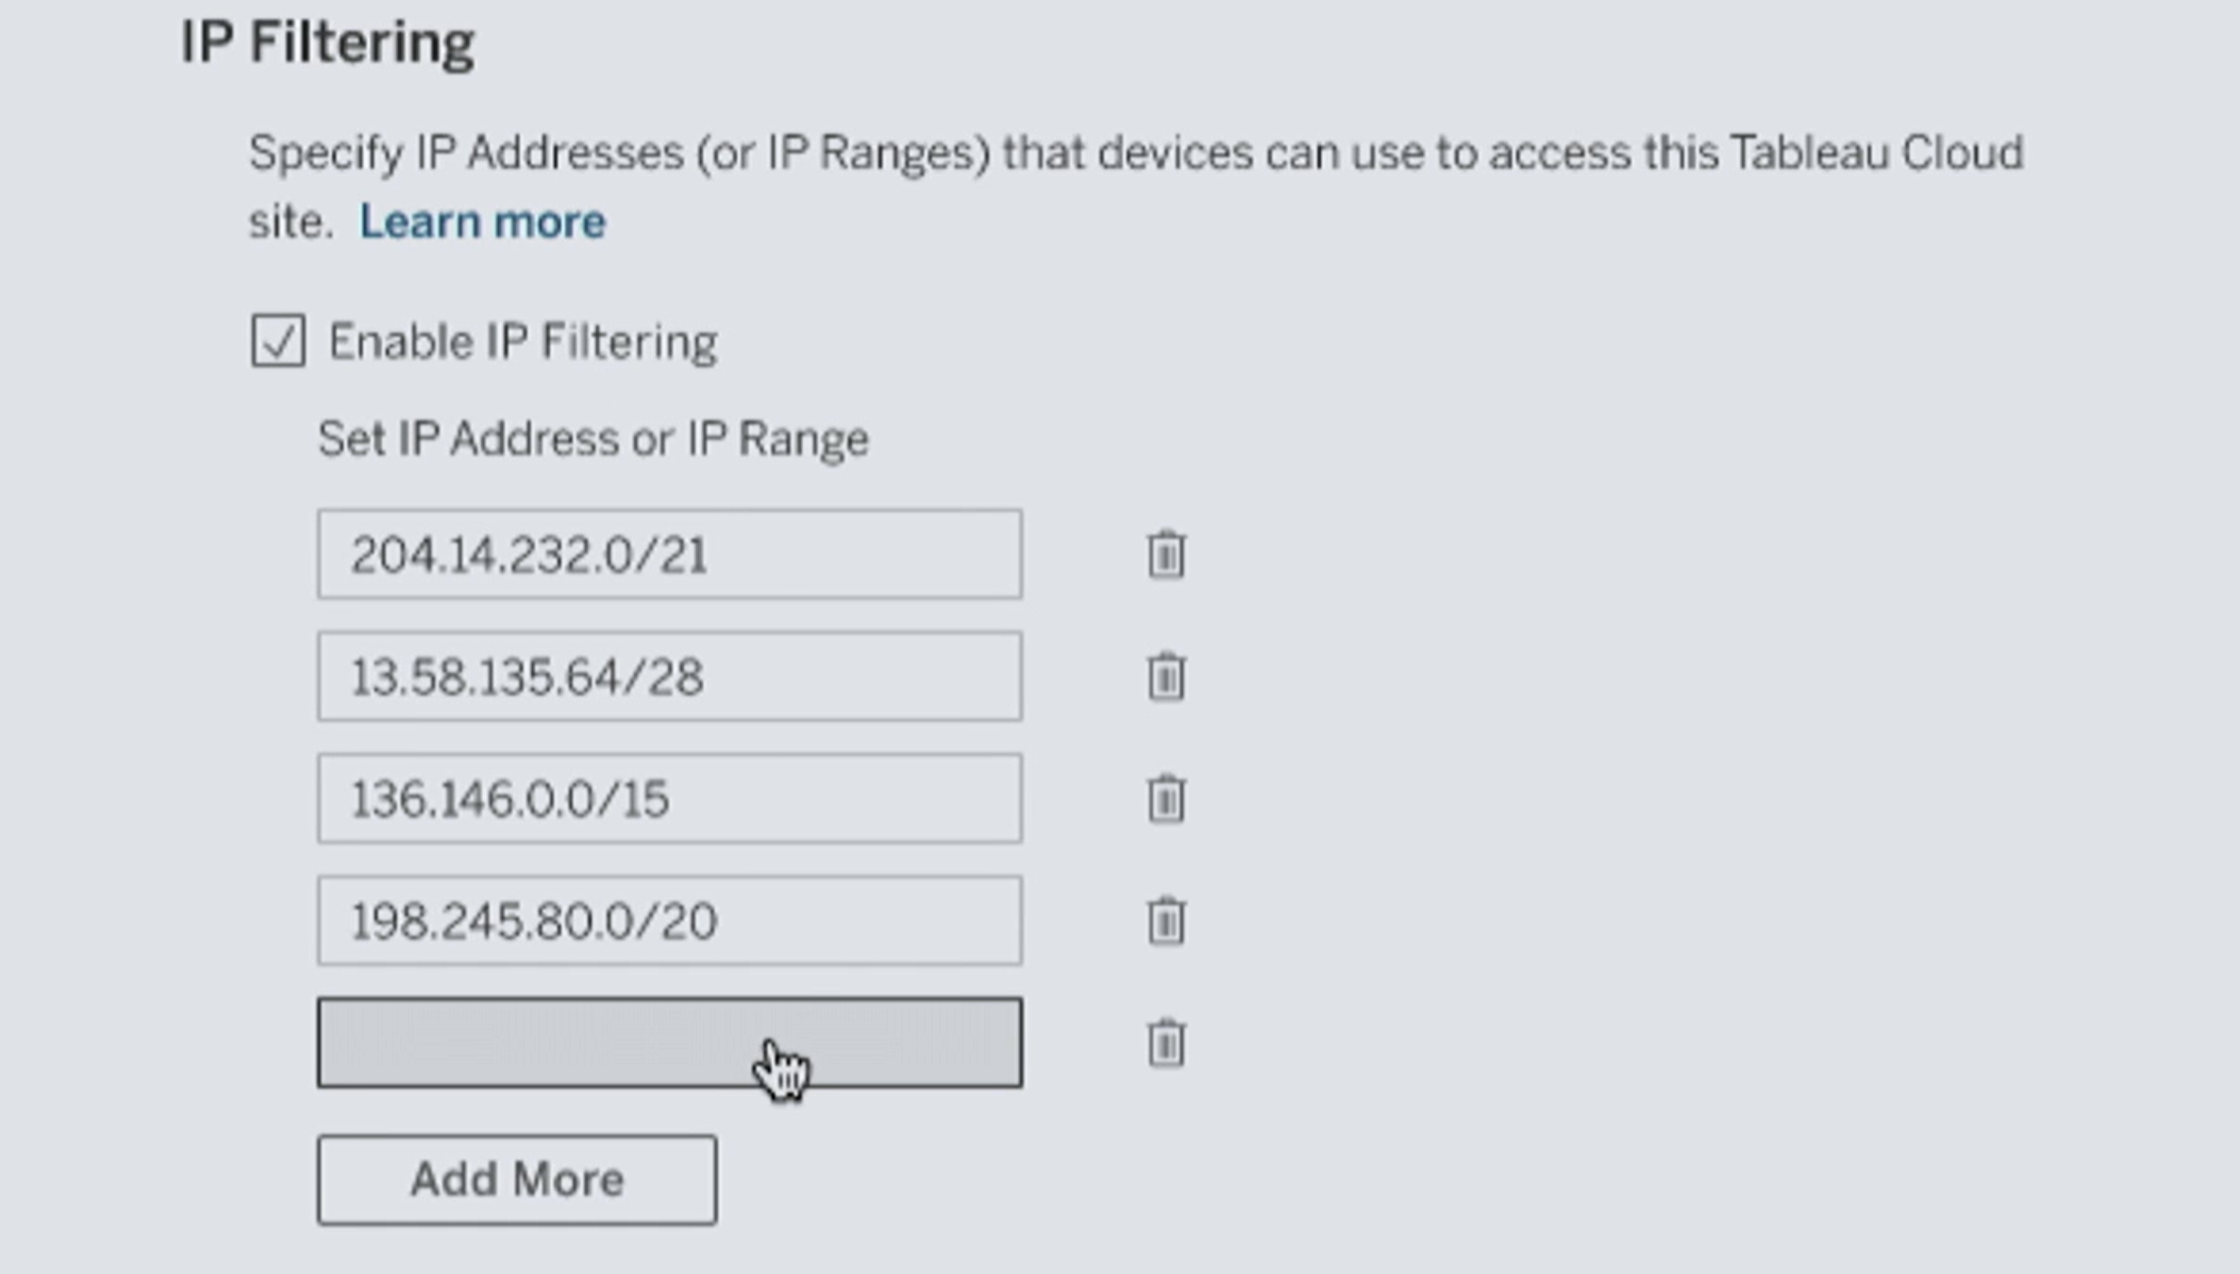
Custom IP Filtering
Admins are now able to only allow certain IP addresses or block specific IP addresses from accessing their environment:
New Features
Lastly, we heard from Senior Director of Product Development Mathew Miller about some cutting-edge developments from the Tableau development team.
Tableau GPT & Tableau Pulse
Tableau users will soon be able to leverage generative AI to assist with writing calculations, generating code and surfacing insights automatically. Stay tuned for a deeper dive into Tableau GPT and its integrations into Tableau Products soon:
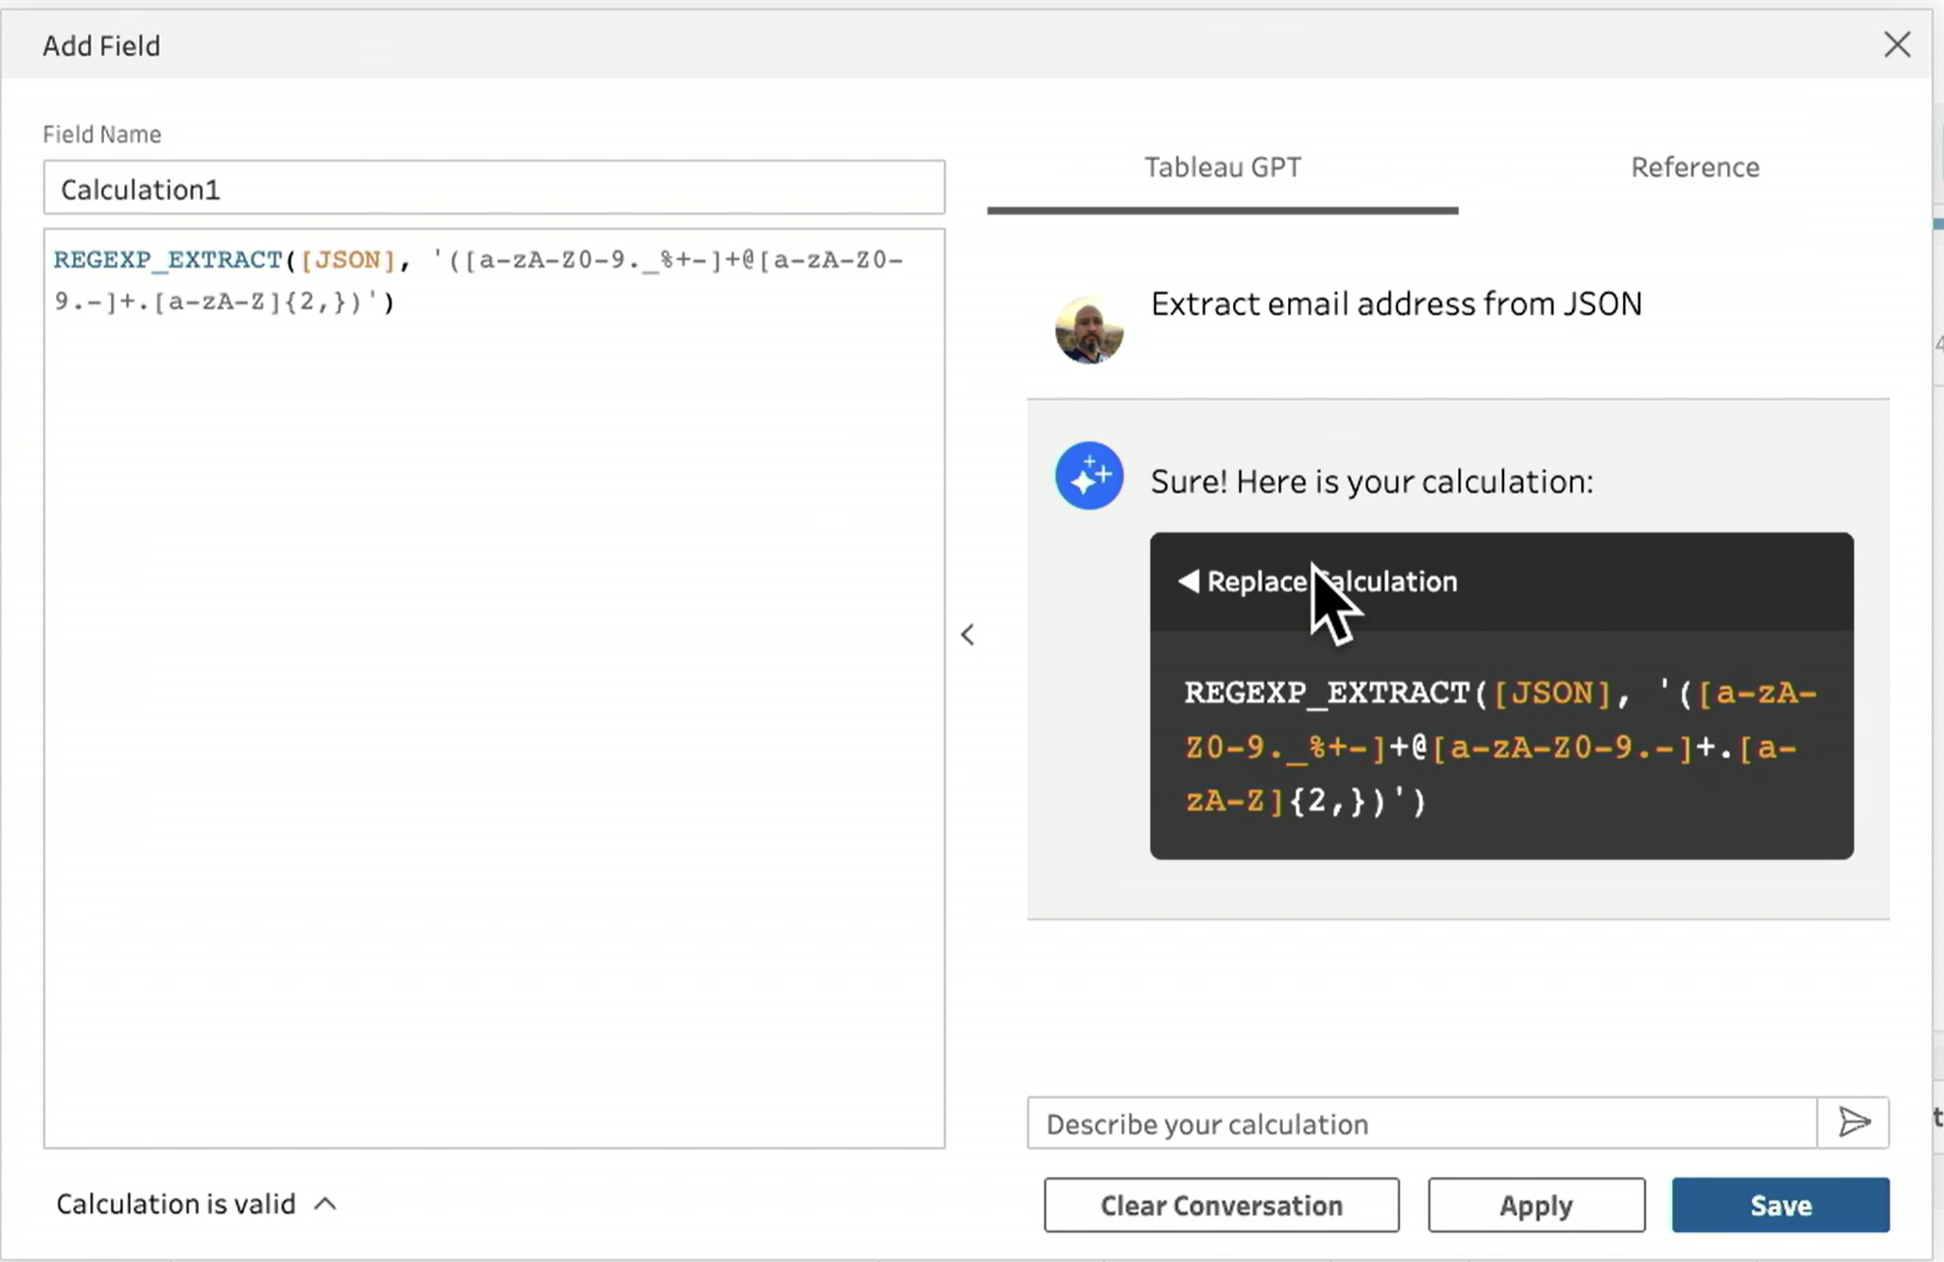
Tableau Gestures
Last but certainly not least, the reveal of Tableau Gestures was announced. Live interactive visualizations rendered over webcam footage. This feature allows for new, innovative methods of data storytelling. Instead of screenshare, Tableau Gestures enables you to interact with data visualizations by simply pointing at them over video!
More information about these new offerings will be shared with users later this year. If you want to work with us on any of these new Tableau offerings, drop us a line and we’ll reach out!