
While my day-to-day is spent working within Curator’s PHP platform, my favorite programming language is Python. I used it daily in a previous life after learning it on the job nearly two decades ago. I’m not going to lie—when I first started learning it, I actually thought, “This language is so easy, there’s no way it can be used to do anything useful.” As you probably know, based on how many things in the world are built using it, it didn’t take long for me to eat those words … and were they ever spicy!
Behold: pdb
One of my favorite built-in features of the language that I feel not enough people know about is the Python debugger (pdb). It’s a game-changer when it comes to troubleshooting and debugging Python scripts. If you find yourself adding a bunch of logging statements, running the program until it dies a horrible, fiery death, then searching through those logs to figure out what happened like some sort of text-based autopsy, may I be so bold as to say that you’re probably doing it wrong?
Effective Usage of pdb
There are many different ways to use pdb, but the simplest is by using its pdb.set_trace() function. Wherever you put this line in your code, the Python interpreter will stop and present an interactive debugger command prompt. From here, you can run any arbitrary Python code, or issue pdb commands to step through or even into the code by using next and step, respectively. Even these have shorthand abbreviations to make things quicker: n and s. When you pair this with Python’s built-in dir() function, you can inspect anything you need about the current state of the program and trace the rest of the execution until you have identified the issue.
If you have a huge loop or a lot of logic between the interesting places in the code, you can put in multiple pdb.set_trace() statements, inspect what you need and issue the continue command (or equivalent c command) to skip ahead to the next break point.
I don’t want to be accused of impersonating Captain Obvious, but I feel I should also point out that you can put these debugging break statements inside special if statements or exception handlers to only trip when very specific conditions are met. This is helpful when debugging a function that may be called countless times during the execution before failing. It can get annoying to have it break into the debugger a bunch of times before you need it. In this way, you may have 99 problems, but pdb ain’t gonna be one.
See It in Action
Let’s say you have the following Python script, and it keeps printing 99 times even though you want it to print 100 times. Use your imagination to pretend it’s as complex as something you deal with in your own day-to-day life:
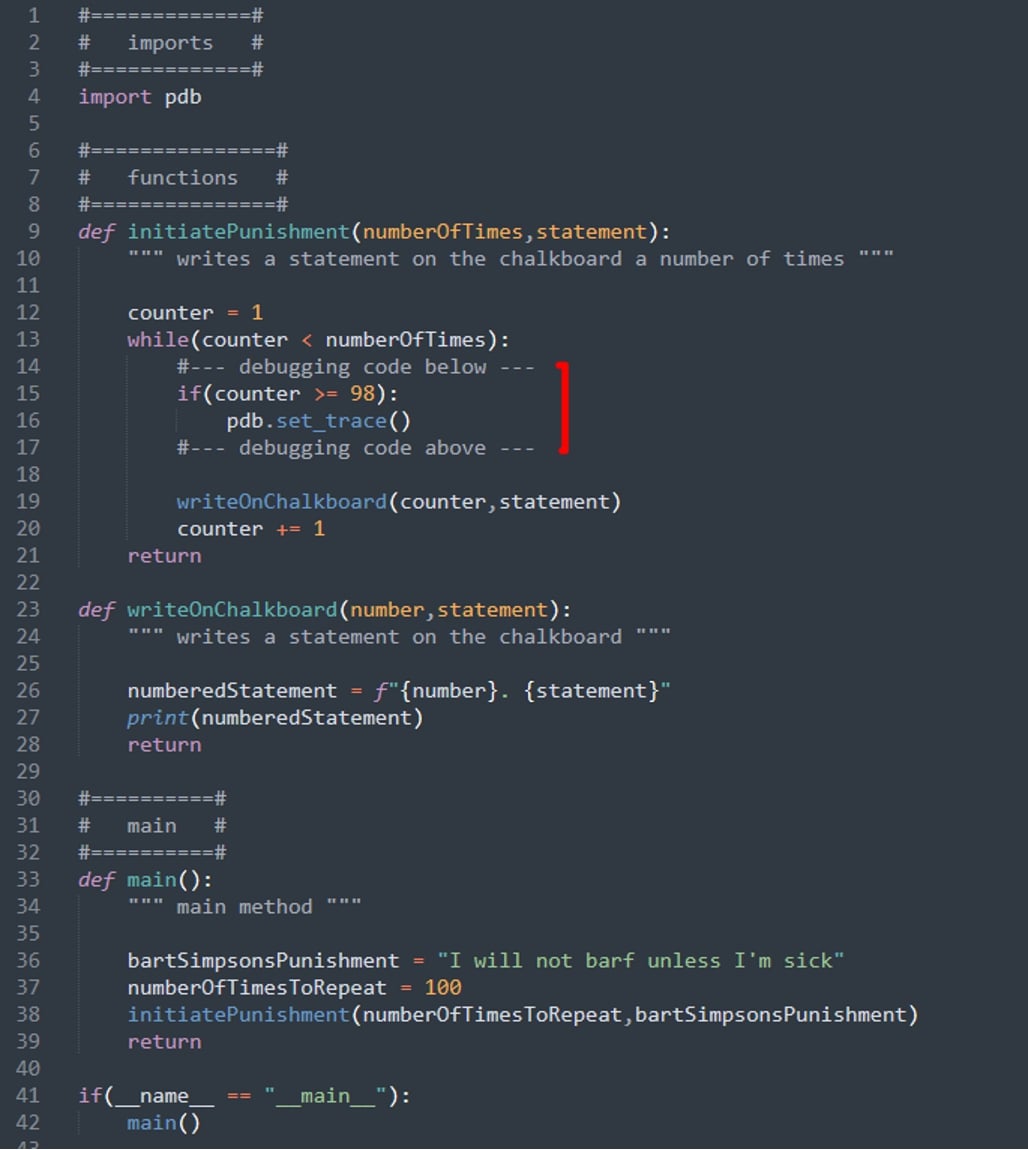
Here’s a simple example of how to use the Python debugger to figure out why it doesn’t behave like you know it should:
Now, hopefully, you’re able to keep things rolling without interruption or inefficiencies.