Tableau Prep has tons of options, and you may have seen gurus pull off some truly fantastic tricks. But what should you focus on? Drawing from my work as a consultant and doing on-demand support via Assist by InterWorks, I’ve summarized my top five Prep go-to secrets: five basics to help you conquer a countless data prep challenges. If these look familiar, you might have seen them at the Global Prep Tableau Community Group session in October 2021 or as a challenge for week 43 of Preppin’ Data.
My Favorite Prep Solves
- Pivoting
- Aggregations
- Joining a lookup table
- Date functions
- Combining data with different structures
Before I show you how these work, a quick word on the rationale for these choices.
- Pivoting and aggregations are super basic, but they are also the most common things I see clients hitting issues with. Both can be done in Tableau Desktop, but often your data is set up in a way that makes this tricky to accomplish and has you turning to Prep.
- Lookup tables are amazing. Imagine you have data for different products, and you need to create a ship date. But instead of this being standard, the time to ship varies by product. You might be thinking case statements, and you’d be right. But what if you have 100 products, not just five, and these timelines can change? Then you’re into Prep territory, particularly if you get even more wacky and want to vary the formula by product category (and yes, I’ve seen this done).
- Date functions! These are actually in my top five for Desktop or Prep, and I’ve done a mammoth two-part blog on dates in Desktop as well; it’s just so common. I never seem to stop hitting queries about dates. In the below video, I’ll cover my most common queries, which are generally around making dates, adding to them and comparing.
- Combining data with different structures. This is more of an approach and a general tip to be comfortable with joins, but it’s common enough I wanted to have it here. Say someone has a few sets of data and you want to bring them together, but the data structure changed each year. Some changes can be made in Desktop, but imagine you need to prepare the first item one way, and do a bunch of things to prep the second in a different way. That’s pretty hard outside of Prep.
Demoing the Tableau Prep Solves
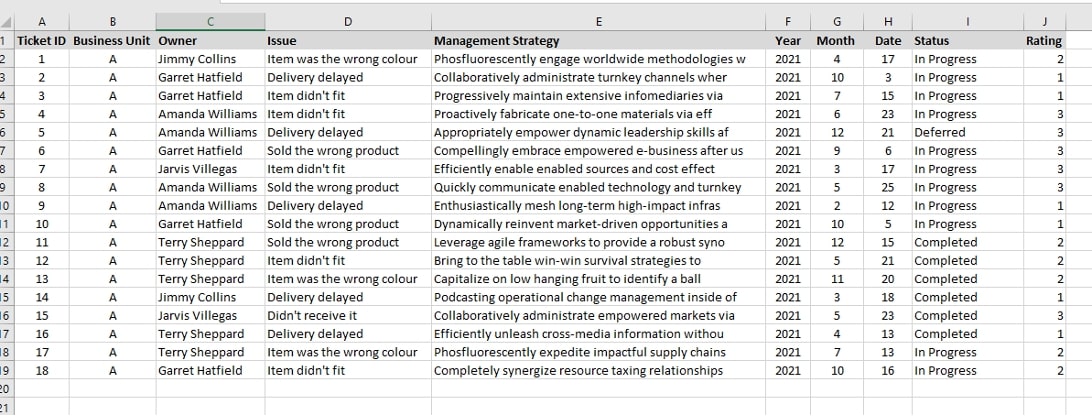
For these, we will use the following example. It’s complaints data, and it’s not too bad. At first glance, we can spot a few things that might trip us up—our date is in an annoying format, and we have rating as a number:

It might all be okay except:
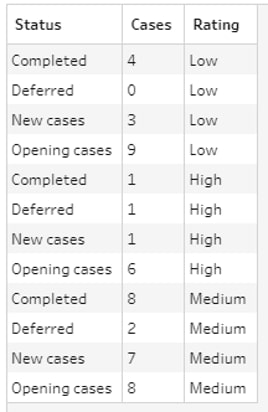
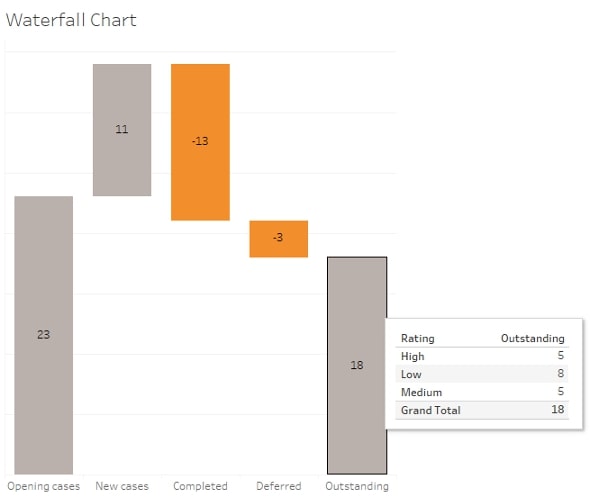
- We want to analyse our data to see how many tickets we went into the last quarter with, how many were new, what we completed and what we were left with. Some of this involves counting the same case twice (e.g., there at month opening and also completed within the month).
- We want to be able to combine this with data from another business unit that is formatted a bit differently in such a way that we can make this style of output and this waterfall chart.


Demo time!
Looking for more? Feel free to explore the attached Tableau Prep workflow, and reach out if we can help you more directly!

