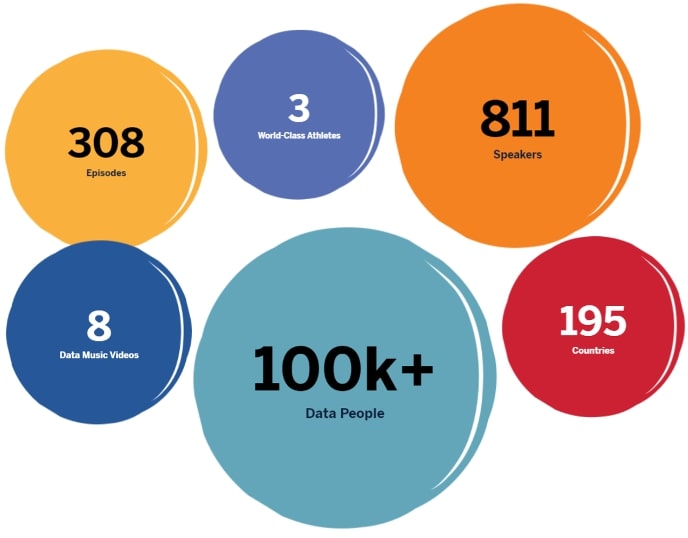
Tableau Conference 2021 was big – really big – with more than 300 sessions and 800 speakers. So how do you know what to watch?
Source: Tableau
Well thankfully, I’ve watched a bunch of them and compiled the highlights. These are the sessions I’d recommend to kick off your binge watching replays, all of which you can find right here.
Performant First | InterWorks
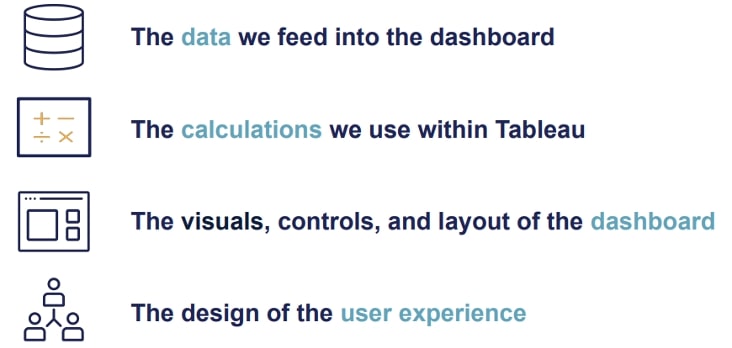
Slow dashboards are a pain. The absolute finest work can be ruined by a slow load time and go totally unused. So how can you make your dashboards hum? My colleagues Ben Bausili and Mat Hughes literally wrote the Tableau whitepaper on this: 82 pages of beautiful tips to make your life easier (and faster). But what if you want the short summary version? Well, this session is it.
In 25 minutes, Ben takes you through the top speed killers across data, calculations, dashboards and user experience and shares tips to boost efficiency in each area. My personal favourites are limiting custom SQL, using fixed dashboard sizing, cleaning your calcs, removing unneeded objects and designing fluid user experiences.
Devs on Stage | Tableau
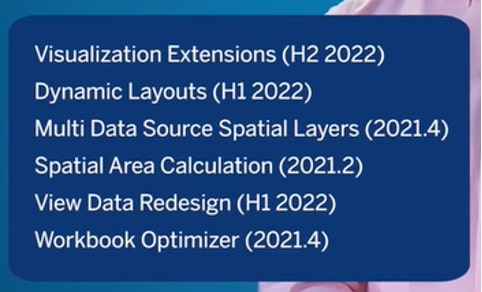
Always a winner, this session features Tableau developers as they highlight what they’re working on and are most excited about releasing. There were some fab callouts, including:
- Viz extensions that give you easy access to cool vizzes others have built, so you don’t have to build from scratch.
- Dynamic layouts will facilitate easier ways to show/hide whole containers as needed.
- Maps will include multi-data-source spatial layers that provide easy ways to combine spatial data and new spatial area calcs.
- View data improvements that allow you to remove columns, sort fields, and then pull and share that data.
- A workbook optimiser that scans your workbooks for performance issues and gives you suggestions on actions. This is what I’m most excited about!
Many of these will be out super soon; check out the roadmap below for timelines. Personally, I can’t wait to try out the optimizer and see how it can help me improve clients’ dashboards and my own. And check out my colleague Dustin’s Devs on Stage recap for a closer look at each announcement.
Source: Tableau
Make It Better | Flerlage Twins
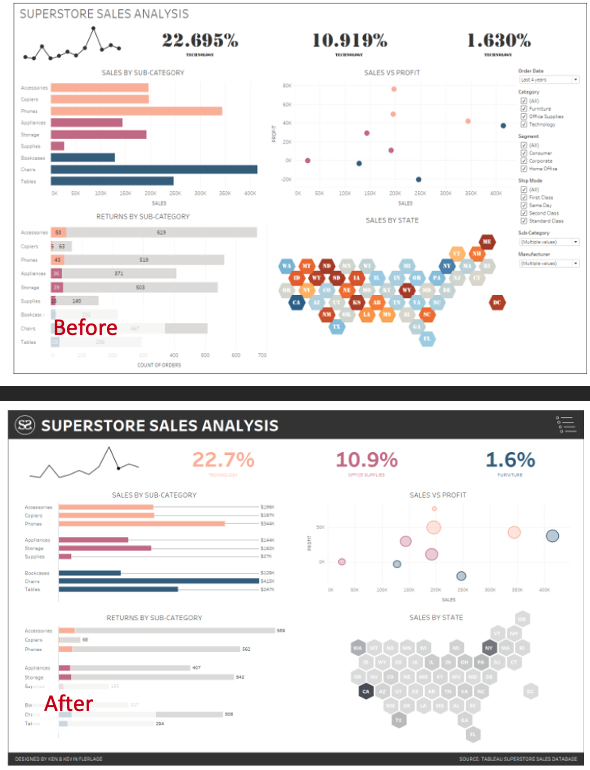
Watching people improve dashboards live is a great way to see improvements in action and get some ideas for your own vizzes. And who better to watch than Ken and Kevin Flerlage? Their blog provides a ton of great tips, and this video is no different. Some of my favorite tips were:
- adding and then hiding subtotals on a bar chart to create spacing between categories
- using transparent shapes to show a single dot on a line chart
- cleaning up a stacked bar chart, including using level of detail calculations and parameter and highlight actions to change which item is first in the stack (omg, yay!)
- using show/hide containers for filters, a personal favourite I use in a lot of my own work
Source: Tableau
Bland to Bold | InterWorks
When we think about design tips for Tableau, we tend to think of colours and clean design. What I love about Chelsea Morgan’s session is the focus on elements that come into play earlier in the process:
- Being selective with what you show
- Prioritize the user, including the insights they need and actions they will drive, and keeping all of this in mind throughout design and build
- Ideating and prototyping using simple tools like pen and paper and basic choices (my personal go-to is PowerPoint) as you’ll be more fluid and comfortable throwing things away and iterating than if you stayed in Tableau
- When refining, focusing on an easier user experience, through utilizing consistency, scale and hierarchy, intentional whitespace and elements like subtitles, tooltips and hovers with extra information
- Collaborating, both during the build and after by seeking feedback on draft products to keep you iterating and improving
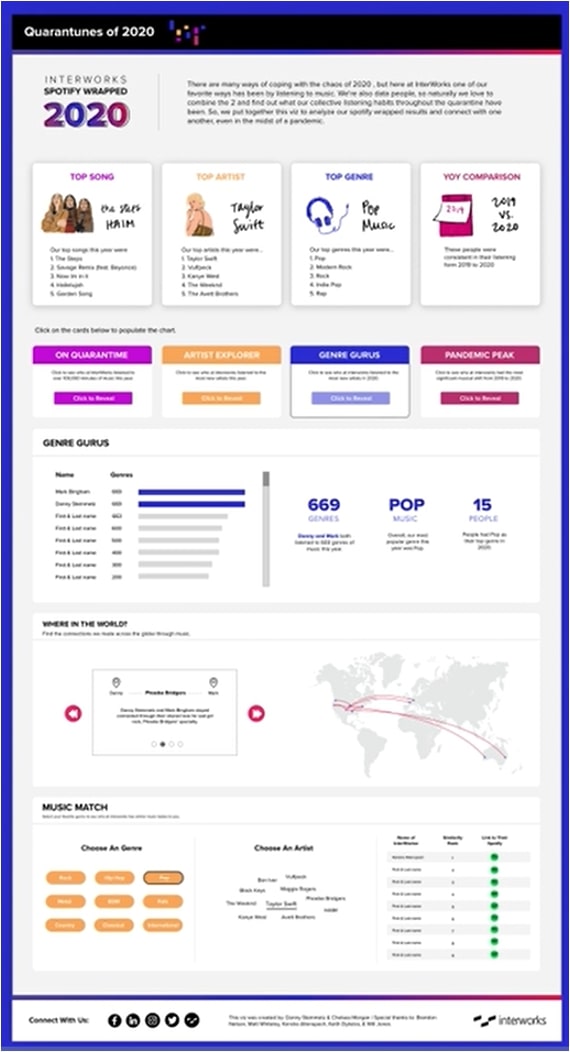
Above: A dashboard example from Chelsea’s session
Tips from Zen Masters | Various
In this two-part session, Tableau Zen Masters each provide a single tip. Combined, there’s a ton of great advice in this one, from general items like using the community to hone your skills to specific Tableau tips. Some highlights:
- Approach your general and technical growth as a T (general and one deep specialty) or a pie (general and two deep specialties)
- Work out how something is working – when you copy and paste a solution, dig deep on why it worked, rather than just running with it; in doing so, you build a deep understanding of things like blue and green, Tableau’s order of operations, and aggregate vs. non aggregate variables and their impact on calculations.
- Remember your focus – we’re building tools for decision-making; never forget the audience and their requirements.
- Copying (with attribution) as the best way to learn new skills

Source: Tableau
Tableau Speed Tips | Various
Twenty-one tips in 25 minutes? Yes please! In this super-fast session, Heidi Kalbe, Lorna Brown and Ann Jackson take you through their top tips for Tableau improvement. Some of my personal go-tos made the list, like:
- Easy number formatting to embed shapes
- Formatting alongside your results
- Using truncated date ranges for parameter lists to give people only the relevant options (e.g. last year of dates)
- Filter referencing in headers, so people know what they’re looking at
And I learned some new tricks I’m keen to test out on some upcoming projects:
- Managing tricky order of operations interactions between table calcs and dimension filters to ensure you can filter but still show rank results
- Using parameters to allow zooming in on a trend line and back out again
- Navigating Tableau’s relationship model, specifically when dealing with different date granularity
Source: Tableau
Even More TC21
If you’re like me and just can’t get enough of Tableau Conference, InterWorks has a few more resources for you to check out. Tune into our latest podcast episode in which Ben and Kent discuss their experience at TC21 and favorite moments. We also take a walk through our extensive history at TC and revisit some of our favorite campaigns (Data Love? The Data Journey? Be still our hearts!). And if you want more support around Tableau or want to talk through some of the tips or features you’re trying out, feel free to reach out! We’d love to help you – and nerd out over data together.

