As always, the keynotes from the Tableau Conference, even virtually, are always an exciting highlight, and I love getting to write about the things presented. It’s especially captivating to hear from the developers within the Tableau product groups about their work and the newest features coming out during the Devs on Stage segment. This blog is a summary of the features that were shown this year.
Tableau Core Experience
Up first was Nathan Mannheimer, Product Management Director, with new updates coming to the Tableau core experience.
Visualization Extensions
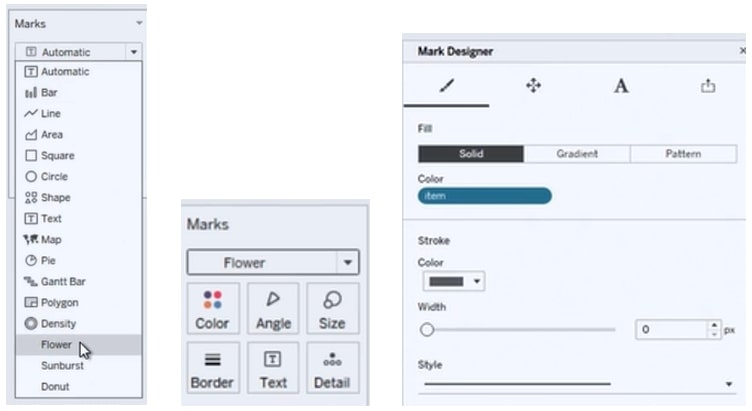
- With custom mark types added with the extensions, the experience of building new charts types becomes the standard drag-and-drop experience we are all accustomed to.
- Flower, Sunburst and Donut charts were shown. Whichever chart is selected allows the Marks card to adjust to what’s needed for that selection.
- Viz Designer/Mark Designer then allows you under the hood to control many aspects of the visualization that weren’t possible before.
Dynamic Dashboard Layouts
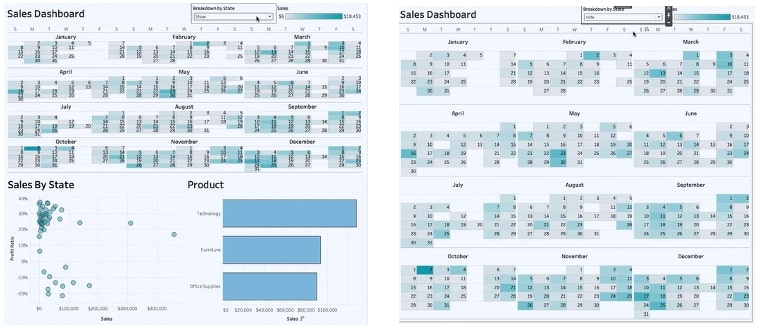
By giving creators more abilities to save space and hide sheets when they aren’t needed – like with collapsing containers, but in a much easier way to execute – these new layouts give us more of the space we all crave and the ability to use it well.
The image on the left has a dashboard that’s scrunched due to the views on the screen, but with a simple Show vs Hide parameter, the layouts become responsive to the selection. Show Hide is no longer just a button but can be driven by a parameter to collapse the container:
Multi-Data source Spatial Layers
Having to create custom data sources with spatial joins for certain types of spatial analyses may have some breathing room with this newest feature demo on spatial layers. As simple as the map layers, adding a new spatial layer is drag and drop. The addition of the new Spatial Area Calculation will also benefit these types of analyses.
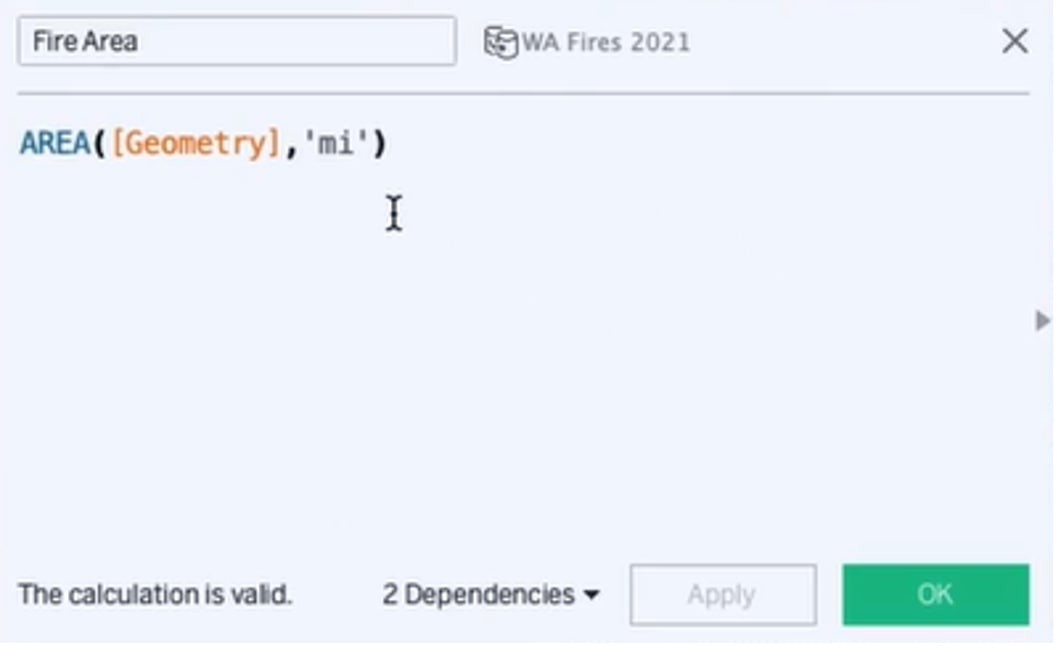
Spatial Area Calculations
Pass in a spatial geometry, and specify your unit of measurement to calculate how large each of your spatial components in your spatial data is:
Some other notable features in this area:
- View Data Redesign will allow columns to be hidden or moved to a desired spot in the table with Download CSV respecting the changes.
- Workbook Optimizer, which will show on publish, will highlight issues that may need to be examined for performance that could harm end-user experiences
Augmented Analytics
Next up was Rachel Kalmar, a Product Management Director with updates to augmented analytics.
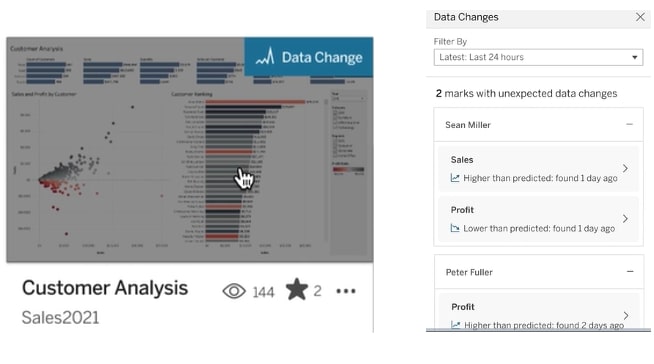
Data Change Radar
Data is constantly changing and refreshing, and keeping up with the many data sources and views can sometimes be challenging. With this new feature, if there’s been a meaningful change or anomaly to the data, the user will be shown a new message on the views within server. Upon clicking, a new Data Changes sidebar now explains the message. Explain Data will also be coming to this feature later to allow you to know more about “why” the data changed:
Explain the Viz
Tableau is again working on Explain Data to enhance its features at the dashboard level. In this demo, a new dashboard was published that Rachel was not familiar with. What important things should she investigate? With the new Discover menu button, a new Discover side pane will appear to assist her in knowing what to explore first with Explain Data to the mark level nested within it:
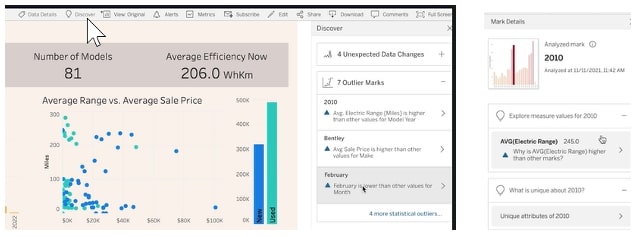
Below are some more features of note in augmented analytics:
- Ask Data enhancements for sharing our findings to the Server, Slack or Users. There will also be phrase-building to help with query-building.
- Feedback button to allow for author contact regarding dashboards
- Personal pinning
- Embeddable Ask Data within Desktop
Tableau Prep and Prep Conductor
Next up was Issa Beekun, a software engineer who announced updates to Prep and Prep Conductor.
Virtual Connections
Starting with virtual connection, we see that if a single table is updated, we now have the ability to update that one table within a connection of seven tables, making data management simpler and less taxing on the server resources.
Prep Notification on Slack
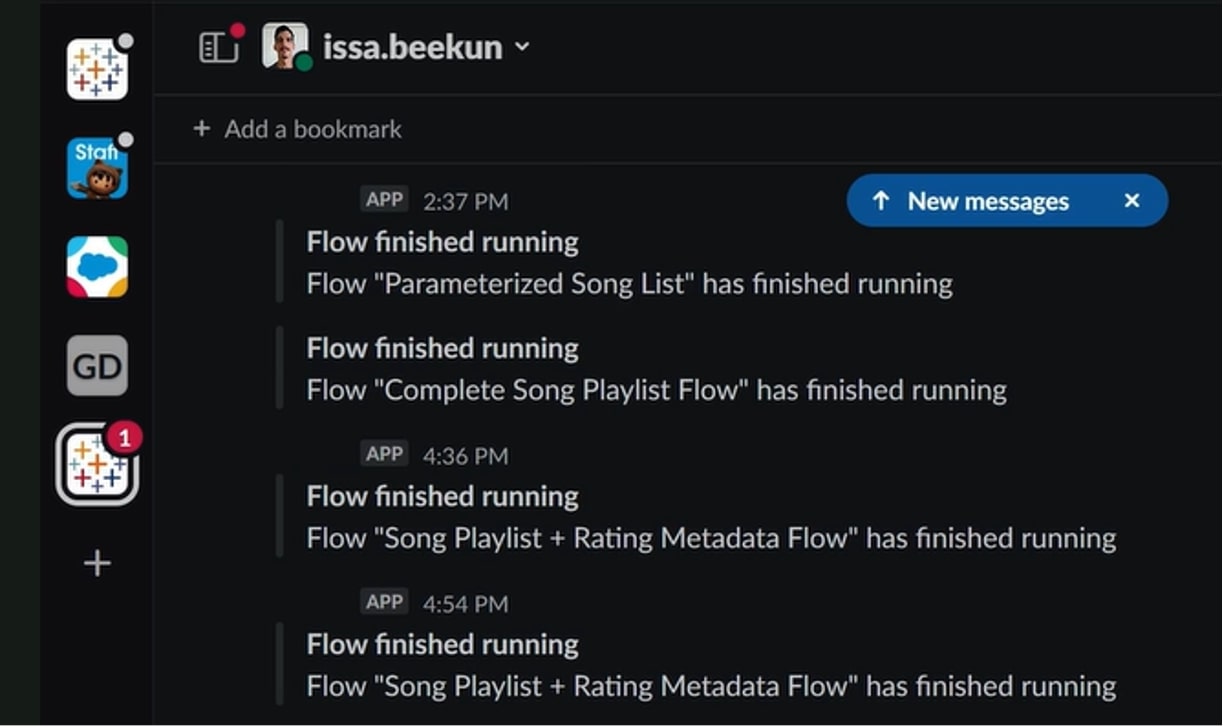
Adding to the data management within the virtual connection start, as Issa brings in new data to connect with the already existing data within Prep, he can now configure a notification to Slack to update him when that flow finishes:
Prep Conductor Linked Tasks
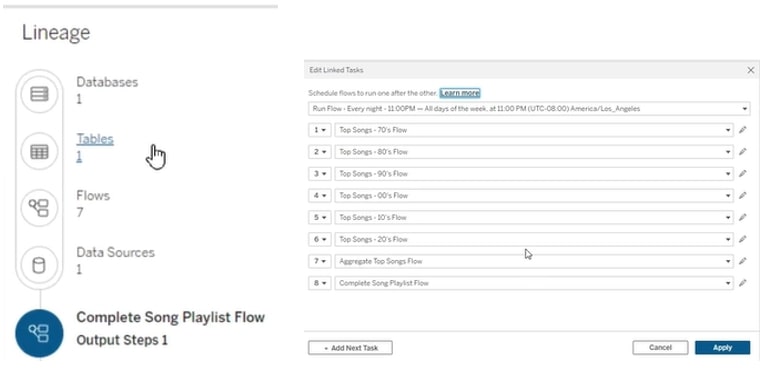
Continuing in the demo, when multiple flows are in order and need to run as other flows finish, there will now be the addition of a feature called Linked Tasks. Within updates to Lineage, a flow can now understand when to kick off based on the flows needing to run before it should. You can also see the linked tasks on your flow after setup:
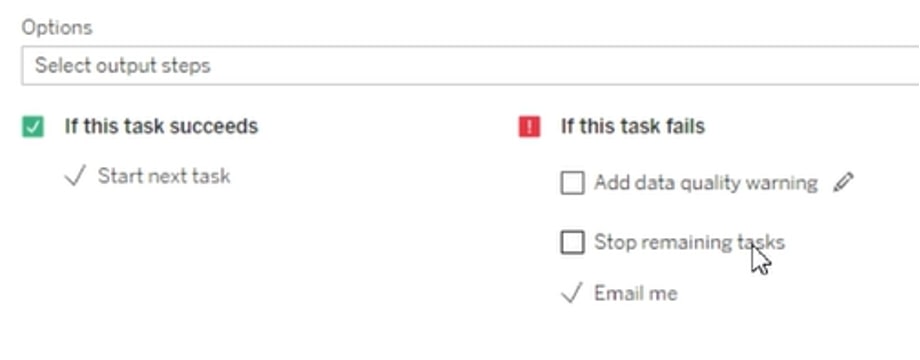
It also handles failed flows within the links and can stop flows after a task that fails and notify the creator. These are great features for managing data at scale:
Another important feature relating to Prep is the addition of parameters for input and output steps.
Tableau Server and Online
Next in the Devs on Stage session, Alexzandra Caldwell-Wenman, a Product Management Director, spoke about updates to Tableau Server and Online.
Server Performance Views
Understanding what’s happening on your server is a key component of an effective management strategy. With new Server Monitoring views, we can find out where views may themselves be the culprits of poor performance, not necessarily the Server itself. Take the calculated baseline for your system, or set your own to see where your views fall:

Resource Limits
One of the most requested features for Tableau Server is now starting to become a reality. Have you ever had a multi-site environment lock up because a single site consumed everything, preventing others from utilizing their site and views as well? With the introduction of Resource Limits, you can control these processes for a more consistent experience across whatever your implementation may be. Plus, these are configurable on the fly at any time:
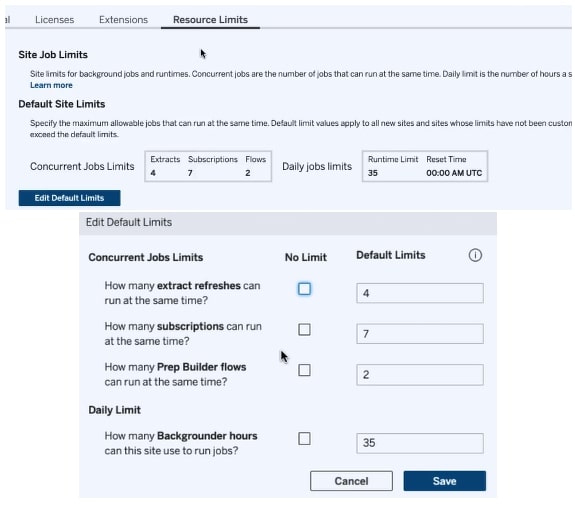
Tableau Online (Server) Connected Apps
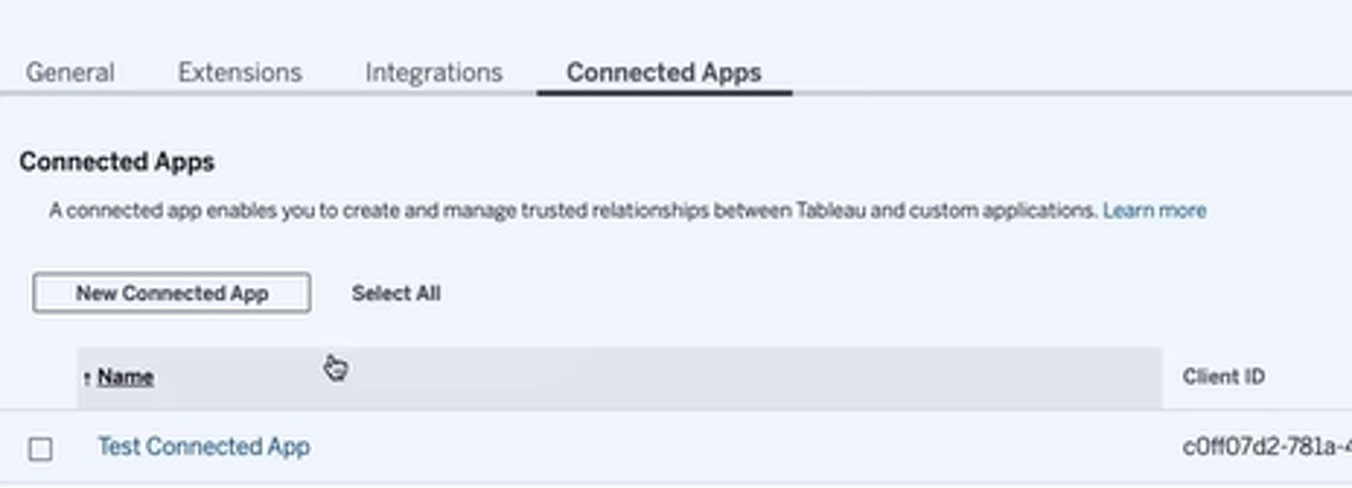
Embedding Tableau Online within your authenticated sites has been a cumbersome ordeal for many. With the upcoming release of Connected Apps, Tableau is attempting to make this easier with a new Secret to Client connection:

A few other features to note here:
- Timestamp granularity to Ziplogs
- Tableau Broadcast for External User cases for public use cases with Tableau Online
- Auto-Scaling Backgrounders within container deployments
Tableau Public
Next up came Jamar Fraction, a Product Management Director who laid out updates to Tableau Public.
Tableau Public now represents the largest data repository on the internet for interactive data visualizations. A huge accomplishment to note is that Public just crossed over its two millionth publication. Props to this team!
Slack for Tableau Public
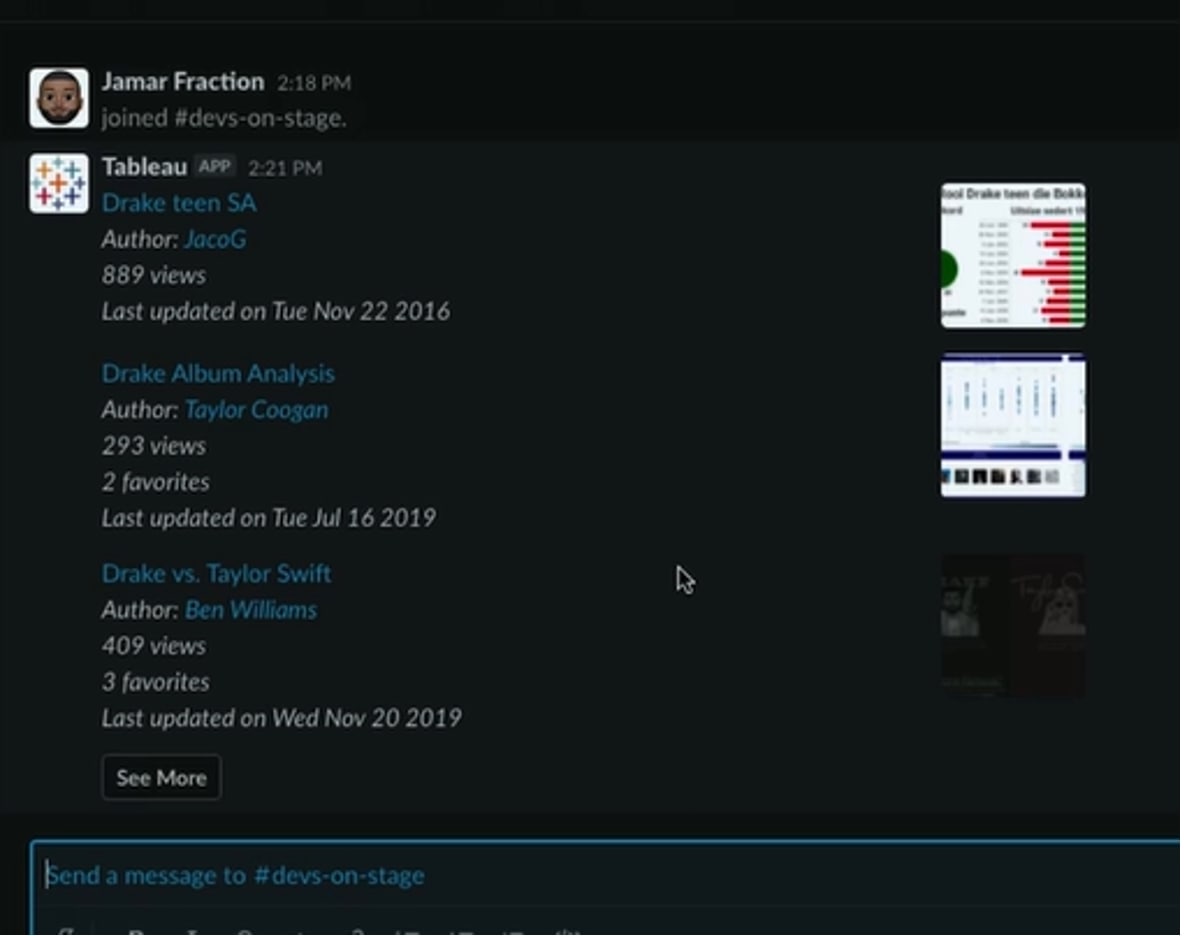
New integrations are becoming available, such as searching Tableau Public from Slack, setting up notifications for Viz of the Day, etc.
A few other noteworthy features coming to Tableau Public include:
- Investments in Search to make finding things easier
- VizCard view-enhancing aesthetics
- Web authoring from Public
- Discover for Public helping you find new interests and increasing in customization
Until Next Year!
That’s a wrap for the 2021 Devs on Stage session. I can’t wait to dive into these new features and am even more excited to see the creative new ways the Tableau community will utilize them.

