There are pivotal projects in our careers that help set our paths towards doing cool work. For me, as someone in marketing, the Tableau Conference has been that catalyst. I started at InterWorks over 10 years ago with no marketing or trade show experience. At the time, InterWorks was beginning our Tableau partnership, and even in the early days, we had some fast-paced success by being named the first-ever Tableau Gold Partner… despite being a relatively small organization in the industry. With the momentum of Tableau and our partnership, the Tableau Conference came our way, and we were excited to be a part of it.
An Unconventional Team’s Take on Big Data
However, we knew we wanted to take a different approach to the conference. We were sort of a ragtag team of consultants – a team of people figuring it all out alongside our beloved customers, creating and developing custom tools that enhanced the power of Tableau, writing entire books to help guide users. Again, all of this was happening from a team of 25 or so consultants (we’d eventually grow to 250+ globally, which is where we are today).
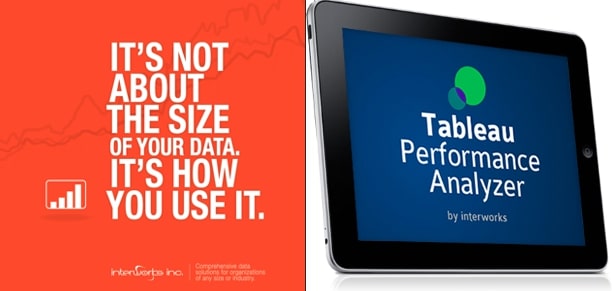
Going into the Tableau Conference in 2012, it was small – maybe 1000 attendees – and our booth was basically a table and some banners. That year, I remember everyone saying the buzz phrase “Big Data” – it was everywhere, so much that I was asking myself, “Big Data, so what?”. I kept asking our consultants internally what that meant to us and our customers, and everyone pointed to the idea that Big Data is only as valuable as how it’s leverage in your organization. From there, a little marketing campaign was born. While a little tongue-in-cheek, it got plenty of laughs at the conference and definitely helped people remember InterWorks’ humor and willingness to be different in a sea of everyone saying the same thing:
This was also the year we started to introduce products and tools to boost Tableau, and these were the precursors to our ultimate suite of tools – Power Tools for Tableau.
As we moved into the next few years, we continued on this path of creativity. Every year was a chance for the Marketing Team to help shine a spotlight on our consultants. We wanted everyone to know how cool they all were. Again, at these events, we saw some pretty standard things, even amongst swag; things like mints, which are really handy at trade shows, but everyone had them. So we made a mint tin that had a surprise for the Tableau community inside: a little laptop with Tableau on the screen. We ran out very quickly when pictures were posted by the Tableau community on Twitter. I still get questions about these sometimes, not just because of the design but also, the mints were really tasty!
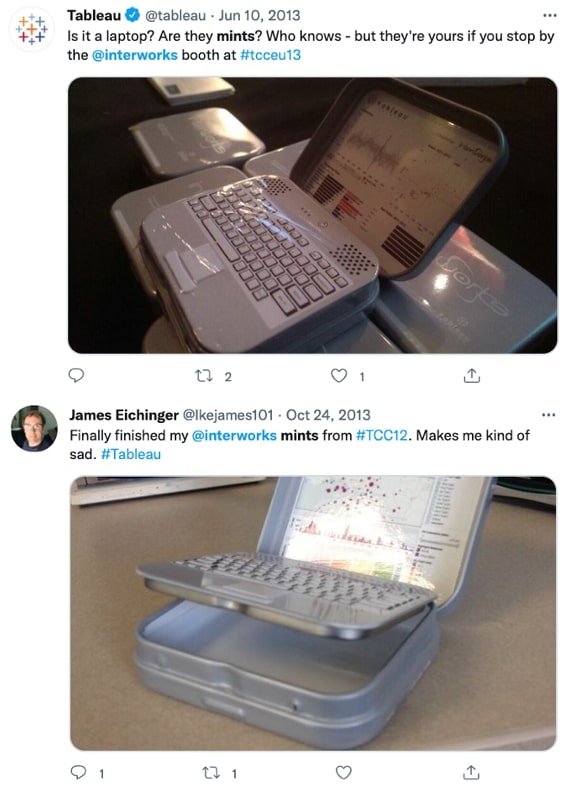
Moving into 2013-2014, we kept pursuing some off-the-wall ideas. In some ways, we considered our approaches in the data/tech industry as a bit counter-cultural, even rebellious, if you will. It was all rooted in our love for data and the possibilities it holds. And what do you do when you really love something? Maybe you get a tattoo.
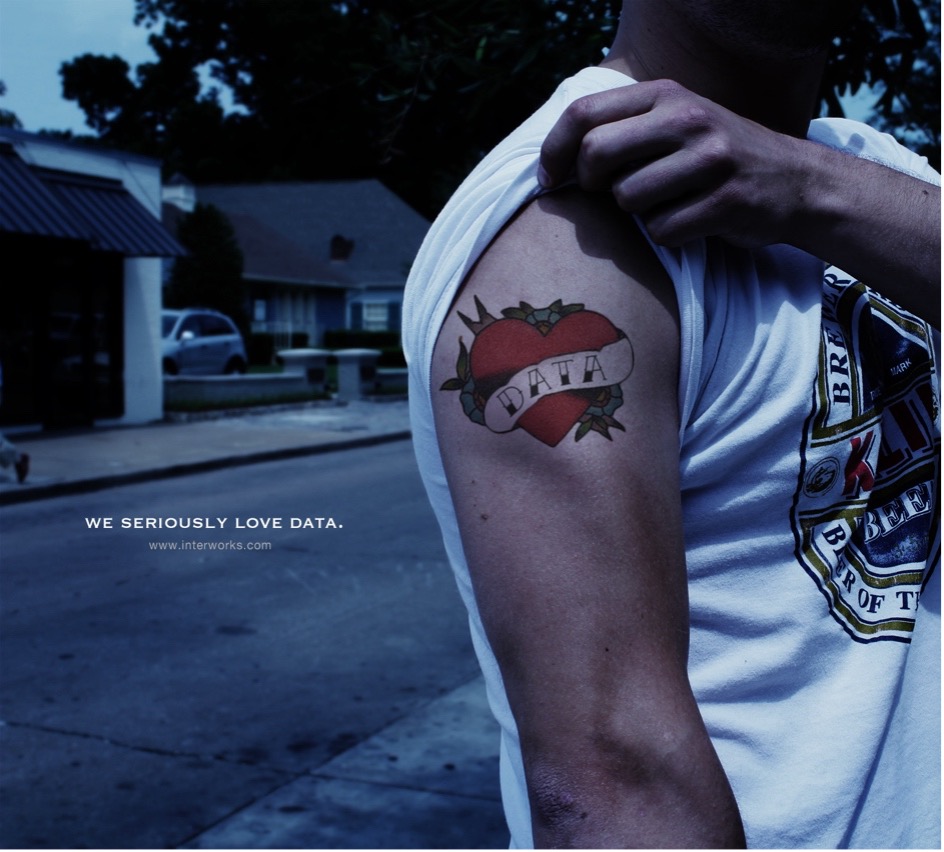
We Seriously Love Data
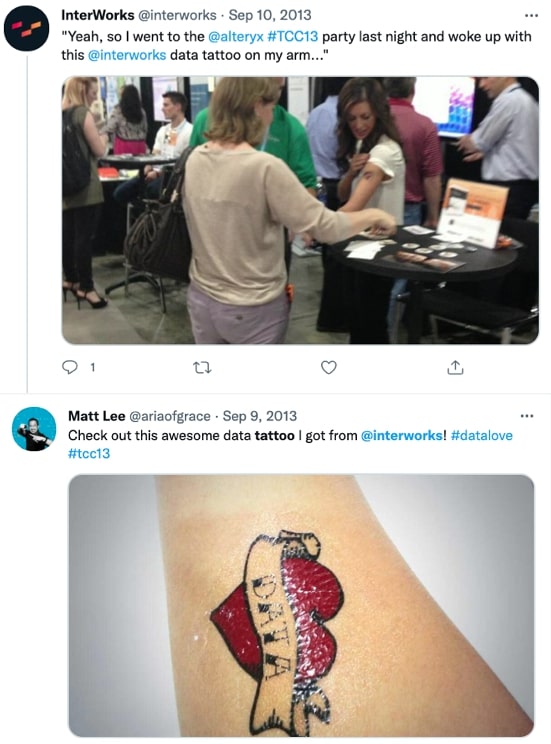
We took the classic “I <3 Mom” tattoo and saw what it looked like if we used data in there, and then we took it a step further. This year, we also created fun #datalove stickers and even had temporary data love tattoos at the booth, which were a hit at the conference:
Jump ahead to 2015 – this was the first year we really went big on our booth buildout. With our campaign, we were asking ourselves, “Beyond Big Data, beyond data love, what are our customers needing the most?”. The answer was a guide on their comprehensive data journey. Our data journey campaign was personally one of my favorites. That year, we also introduced a Tableau community fan-favorite t-shirt design that incorporated iconography from the Tableau interface – sure to catch the eye of anyone who used the tool every day and took pride in their skills.
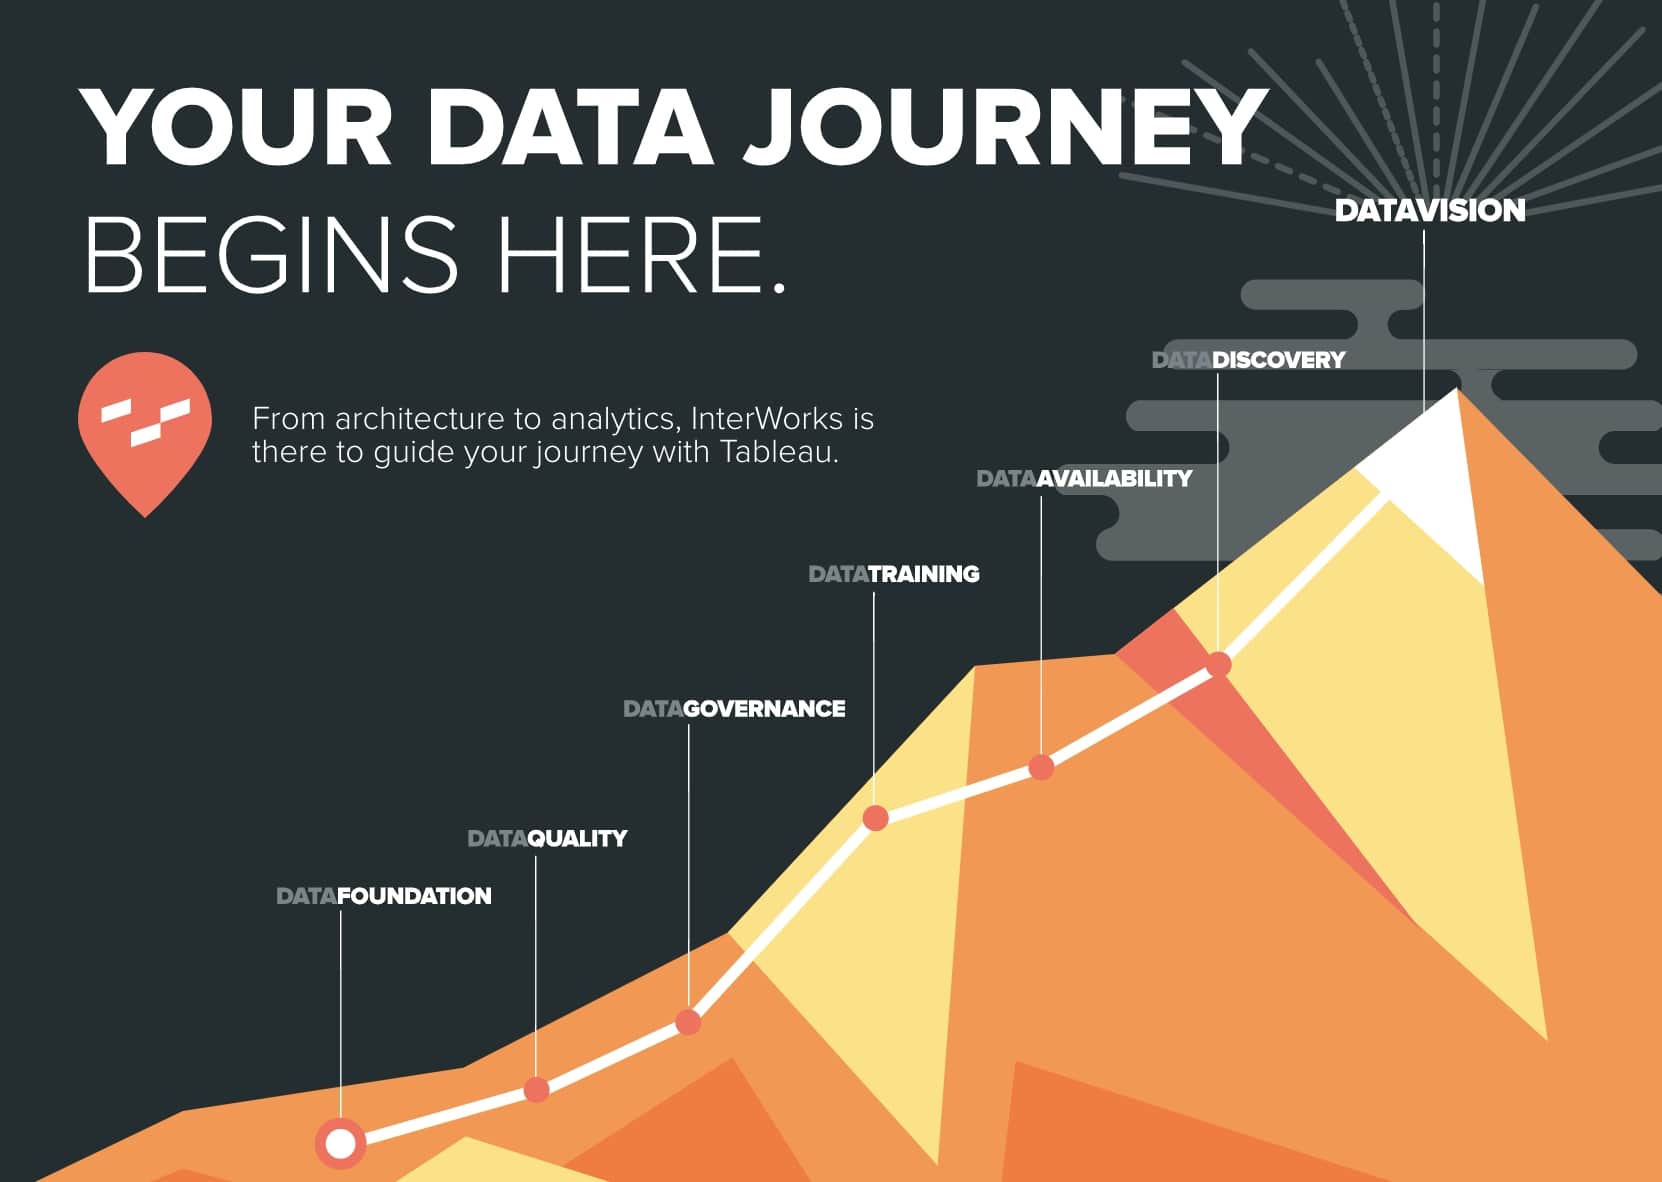
Keep in mind, in just a few short years, the Tableau Conference had grown from around 1000 attendees to 11,000 attendees. We also had an award-winning suite of tools to showcase – Power Tools for Tableau – and a real-life book published, Tableau Your Data!. The scale of the event, the industry and our efforts had been absolutely magnified:
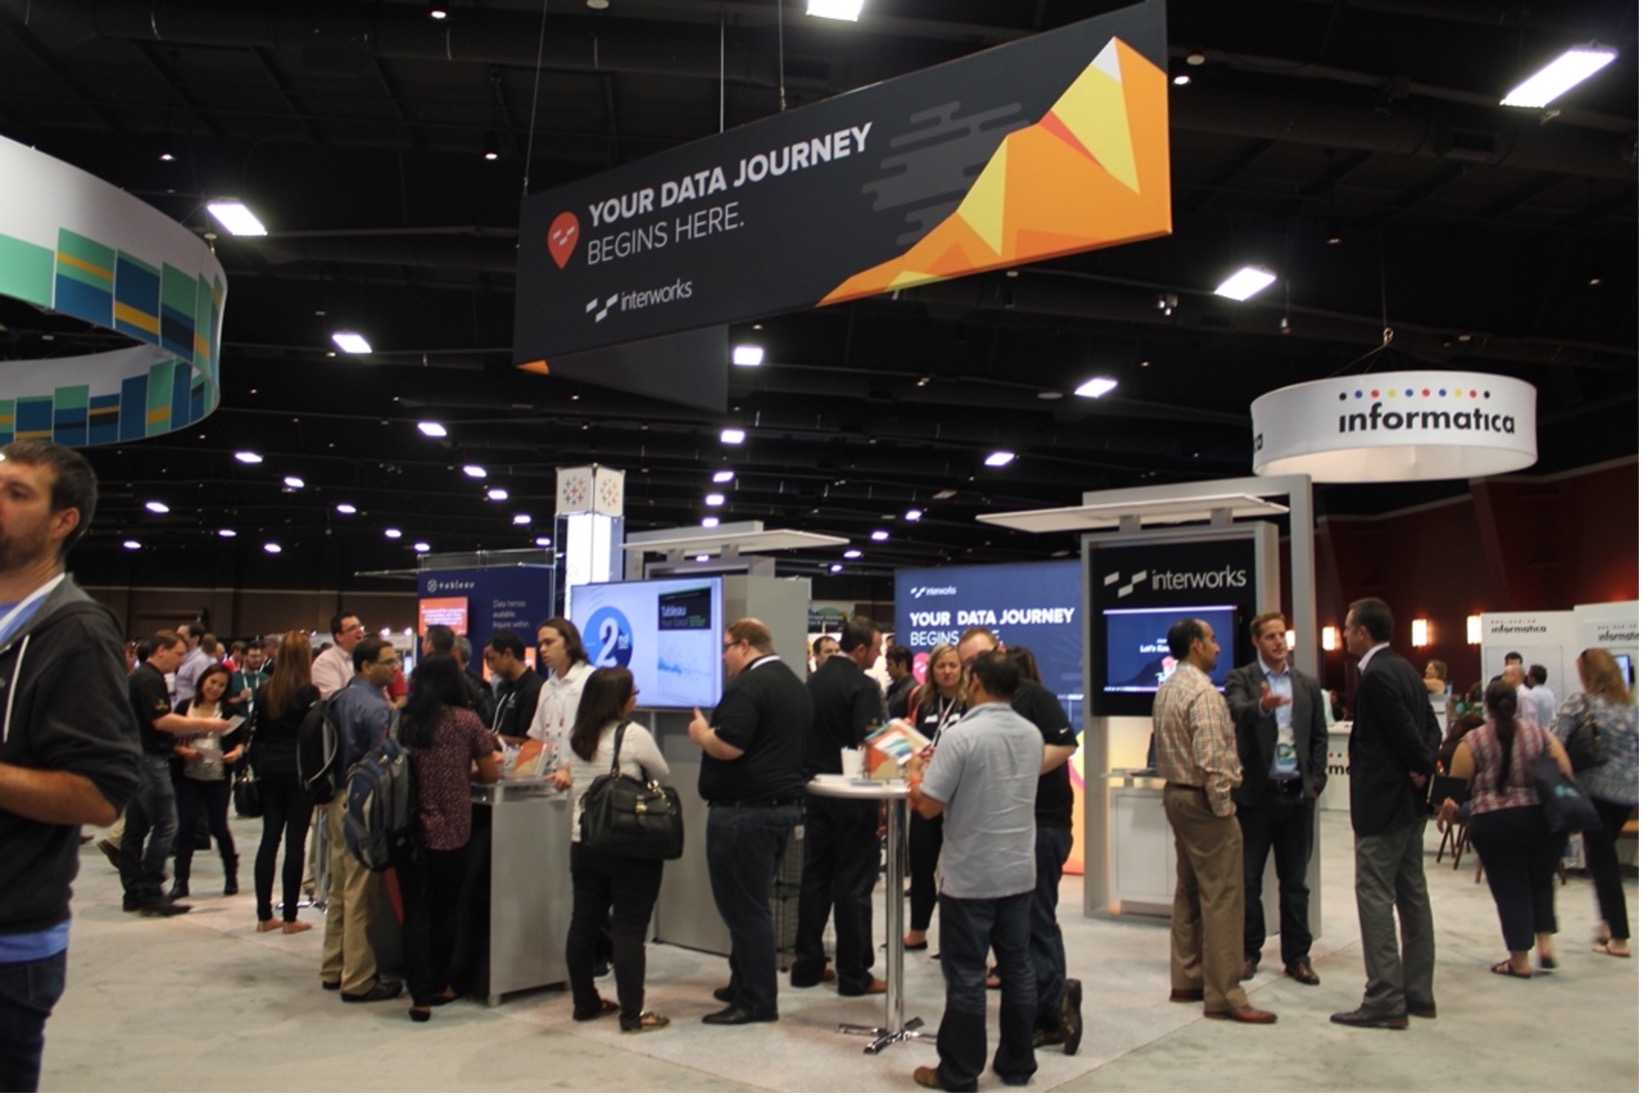
Above: The InterWorks booth at Tableau Conference 2015
Above: The definitive book on Tableau, written by our very own Dan Murray
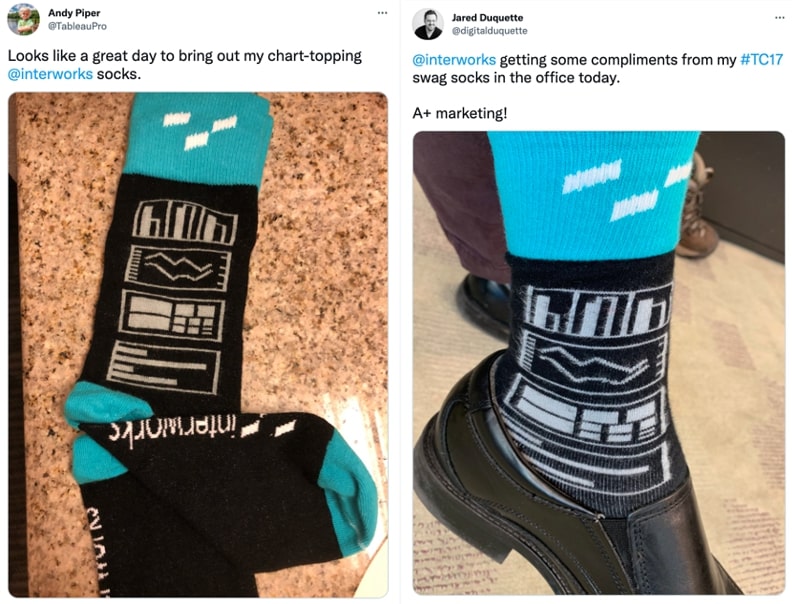
Over the next few years, we continued to listen to our customers and the Tableau community to create campaigns that spoke to them and were fun to make. We created more swag; who would have thought you could have lines of people begging for a pair of data-themed socks? We have literally given away thousands and thousands of these socks since introducing them at the Tableau Conference in 2017, and we still get customers sending us pictures of them sporting them, and even better during the pandemic when shoes were optional:
We utilized all sorts of muses – in 2018, we looked to the concept of a mixtape to inspire us. InterWorks specializes in creating custom combinations of the right solutions and people to deliver better data experiences for our clients, which is kind of like giving a friend the perfect mixtape of songs, just for them. It was a chance to remix your data experience with the Data DJs team from InterWorks. We also had a throwback to the ‘80s/’90s vibe with the design and swag – fanny packs (or hip packs). Another hit: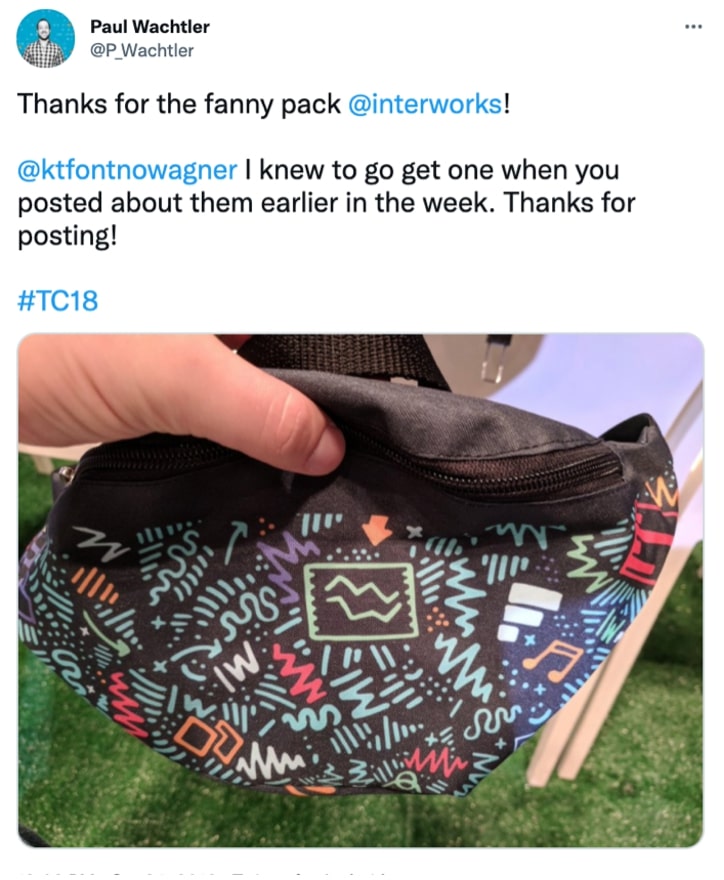
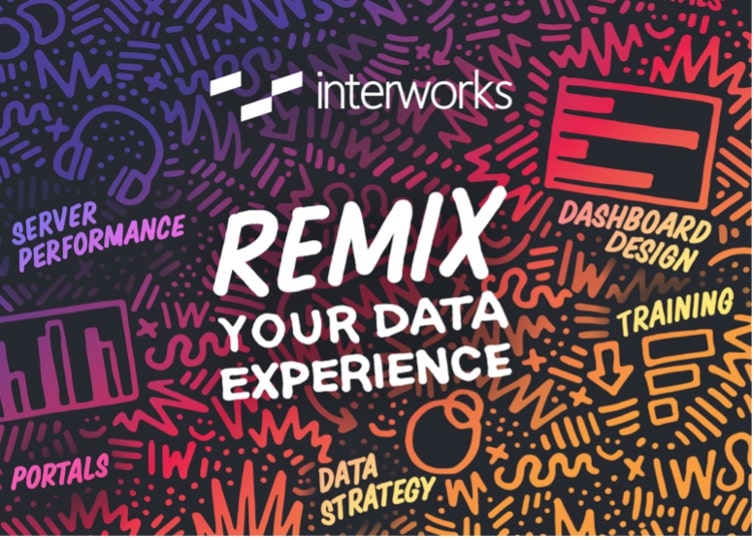
Our most recent in-person conference was in 2019, and we took on the theme of leveling up and tapped into our team’s love for video games. Data can be a lot like trying to unlock the next level, jumping from one challenge to the next. Why shouldn’t it also be fun and? During this time, InterWorks was also expanding into new realms of offerings within our core practices. Enablement established Assist by InterWorks, Platforms founded ServerCare by InterWorks, and the Experience Team transformed the previous Portals for Tableau product into Curator by InterWorks. We were also leveling up our game and couldn’t wait to share that with the 20,000 attendees for another record-breaking year:
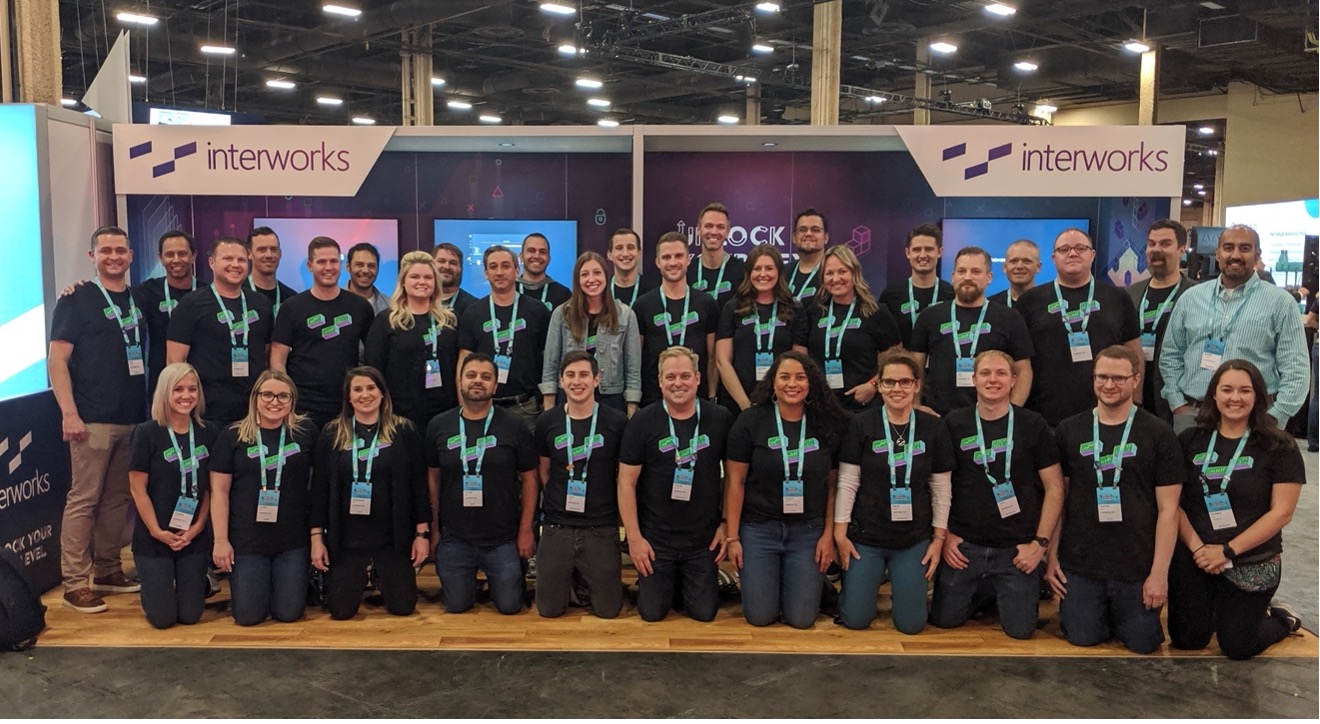
Above: The InterWorks team at our booth at TC19
What we have seen here is just a glimpse of all the work, detail and pride we have put into our experiences at the Tableau Conference (around the globe) for nearly a decade. I certainly did not get to show everything or else this blog post would be incredibly long. In 2020, there was a need to pivot to digital, and again in 2021, we’re looking forward to sharing our team’s expertise with the Tableau community virtually! We’ll be sponsoring TC21 this year with the same enthusiasm and creativity as in previous years.
An Inspiring Community of Data Dreamers
Our history at Tableau Conferences have been very much like capturing lightning in a bottle. There’s so much to share and be excited about and so many ways for us to get creative and embrace technology for growth. We’re lucky that every year we get reinspired and immersed in the passion of the data world via the Tableau community.

