
The summer update of the Tableau platform has given us a few new features for Tableau Server, as well as for Tableau Desktop. Let’s have a look at what was released:
- Notification Integration with Slack: Notifications for alerts, @mentions and sharing; visit our blog post for more details on these new integrations.
- Custom Sample Workbooks: We can now add samples on the start page and are not limited to the few that Tableau provides.
- Improvements on Explain Data: Admins now can control permissions for this feature and more.
- Improvements on Spatial Joins: Now the combinations polygon/line, polygon/polygon and line/line are available instead of only point/polygon combinations.
- SOQL Relationship Queries: New ways to connect to Google BigQuery and ISO-8601 calendar support for the DB2 connector
All of that is basically visible and can learned more about in Tableau’s feature list. BUT. There are a few new things that Tableau did not announce at all, which made me raise my eyebrows. At first, I was a bit irritated, but then I grew quite pleased and wanted to dive in further to these diamonds in the rough. With that said, this post is not about the features above; instead, it is about the hidden, lesser-known new features. Let’s get started.
The Hidden Changes in 2021.3
As many of us are still using older versions (remember that versions before 2020.4 won’t be supported much longer!), we may not stumble upon 2021.3 at all, so for those who have never seen this – surprise!
I am going to give the old version screenshots a red bar on the left, and the new version screenshots a blue bar:
The Data Source View
Let’s start with the data source view. There are three things that changed here.
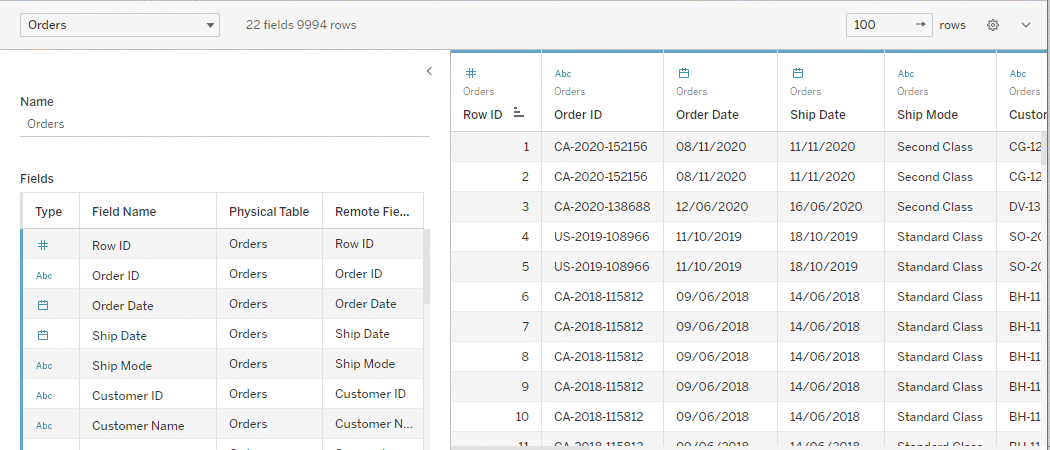
The Field List
Until 2021.2, the view hadn’t changed much at all over the years. Well, okay, in 2020.2 we got the new data model, and the noodle became part of the view. But that’s it. So, this update was a bit unexpected. It’s not a feature; just a rearrangement of what is already in there:
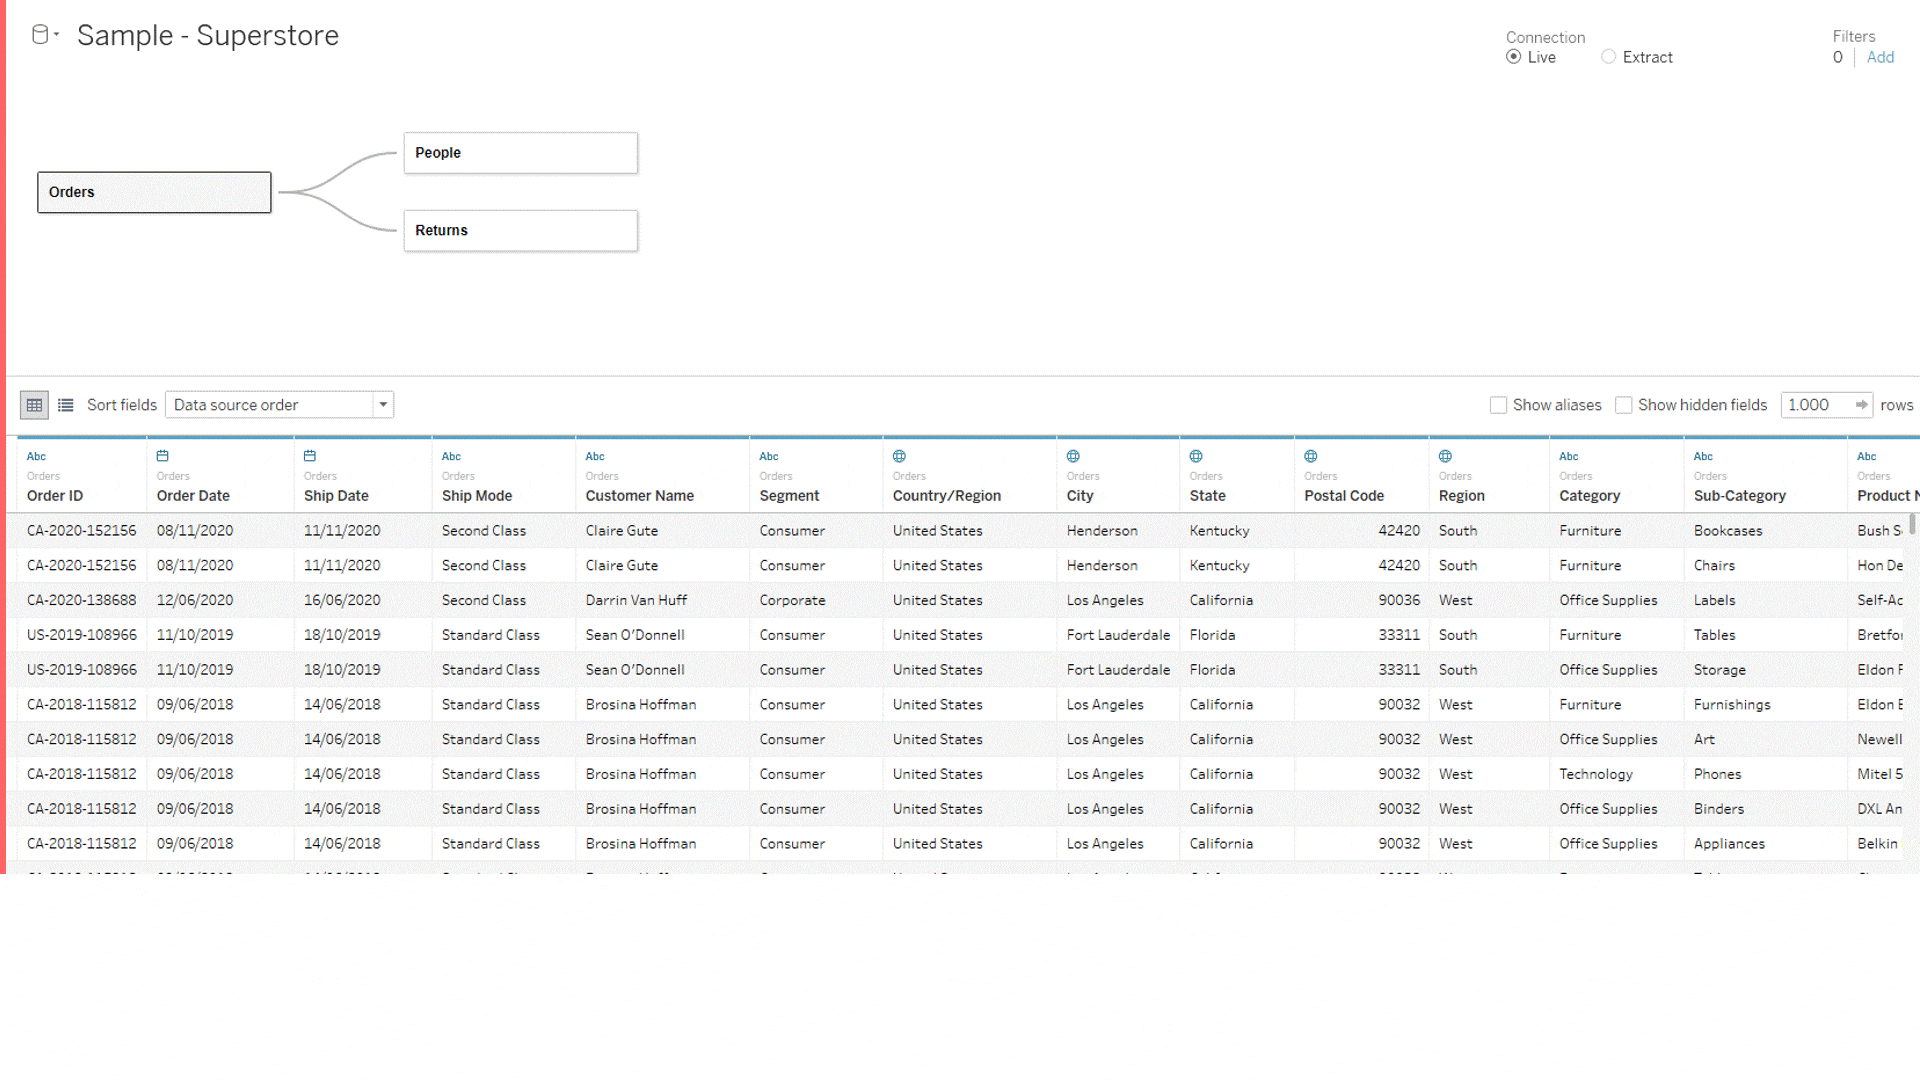
It looks a little bit asymmetrical, but believe me, this helps a lot! The field list on the left has been there all along, but we had to toggle between the two tiny buttons in the first screenshot to get either the field list or the data preview. In my experience, the data preview is needed more often, as taking a quick glance at what is actually in the data is one of the first things I do when opening a new data source. Maybe I’d like to get to know the data if I haven’t seen it in another form beforehand, or maybe I just want to check that the data arrives in Tableau as it should.
The field list, on the other hand, is more of an overview of all the fields in there. It does give additional information: the Physical Table it comes from (like a joined table within a relationship) and the Remote Field Name, indicating how the field is named in the database. If we don’t need the field list, we can collapse it.
Previewed Rows and Icons
This one is harder to spot and something I didn’t even know I wished for. Let me show you the small panel on the right:
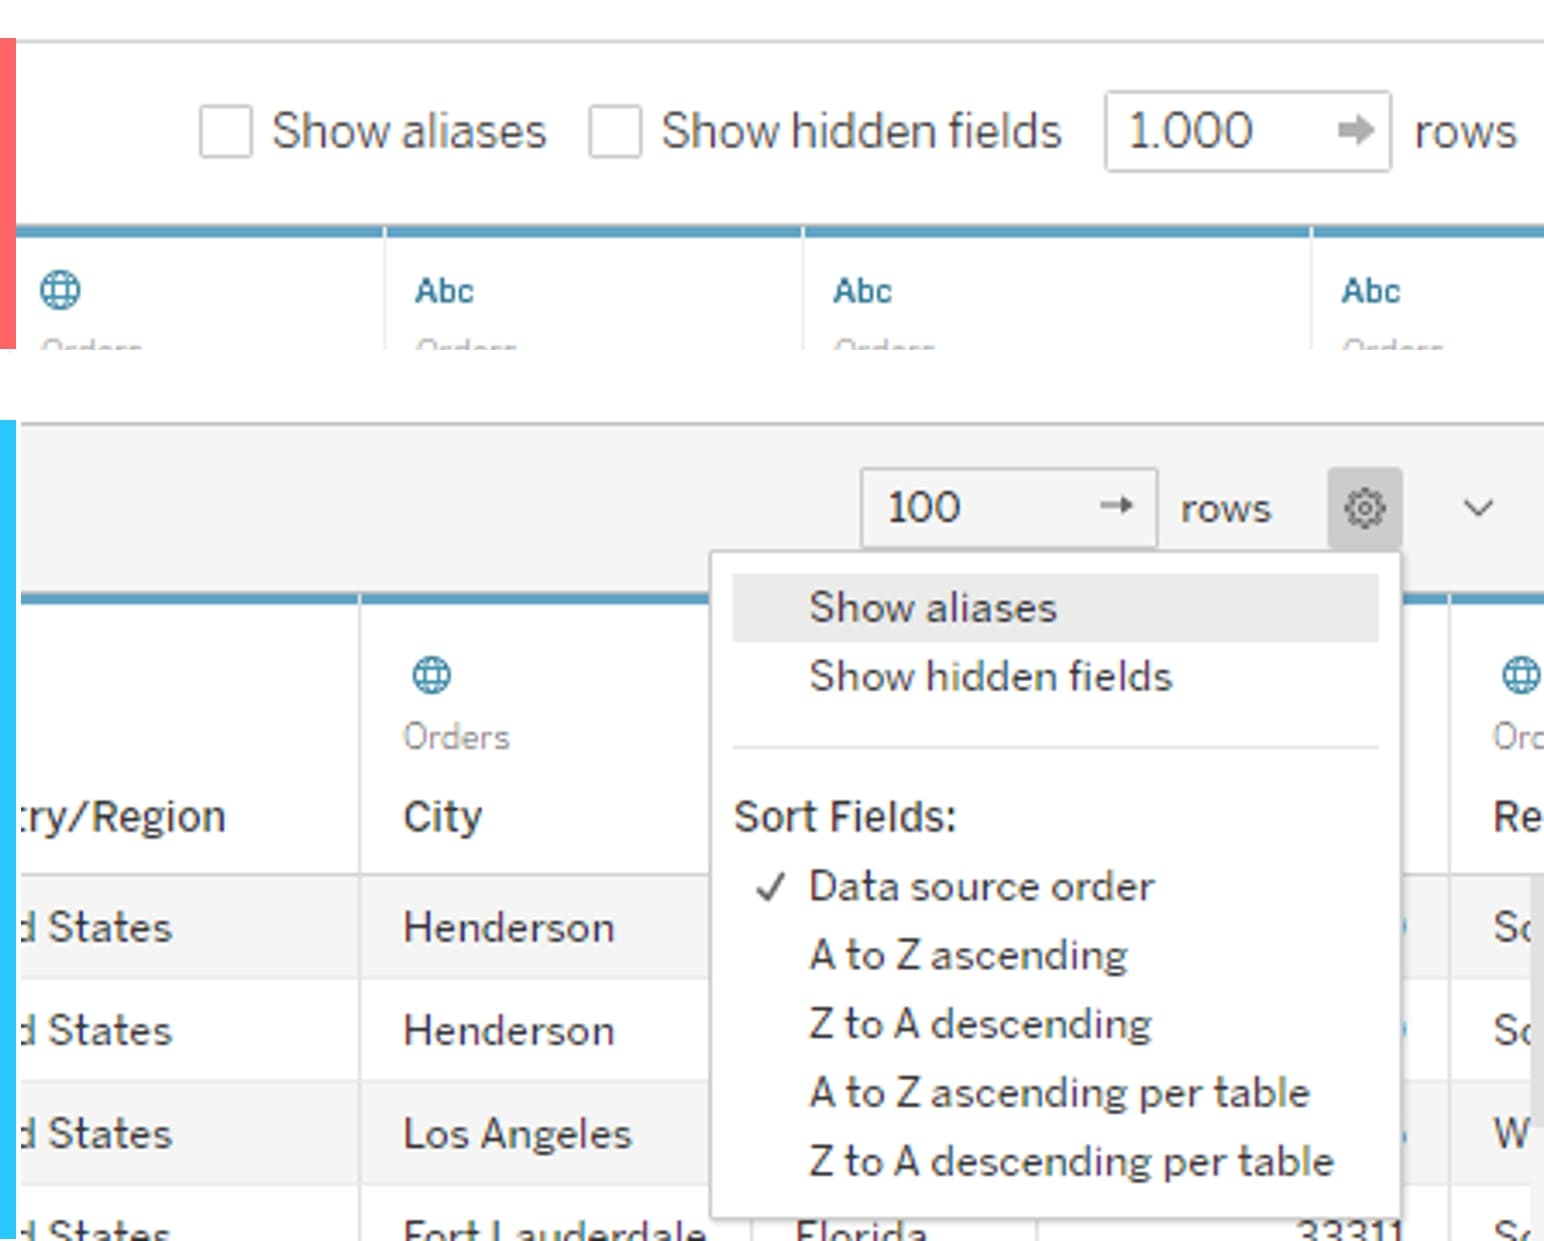
Let’s see:
- We only have 100 rows instead of 1,000 rows in there. That’s pretty great. I almost never need 1,000 rows as preview, and if I have a very wide table with many dozens of fields, loading only 100 rows is a bit quicker.
- The sorting (from the left side; see big screenshots before) and two buttons are now part of a dropdown.
- The whole preview area is now collapsible with the tiny arrow button to the far right.
Current bug (2021.3.1): If you have hidden a field, click on Show hidden fields. There is no drop-down menu on the greyed-out field to unhide it.
Workaround: Go to the field list instead and right-click there for the dropdown:
Relationship Settings
We have one more. The Relationship Settings have previously opened as a dialogue box on top of the data source view. Not in 2021.3. The settings have moved down to where the field list is for the tables. Once we click on a noodle, that field list is exchanged with the settings of this specific relationship:
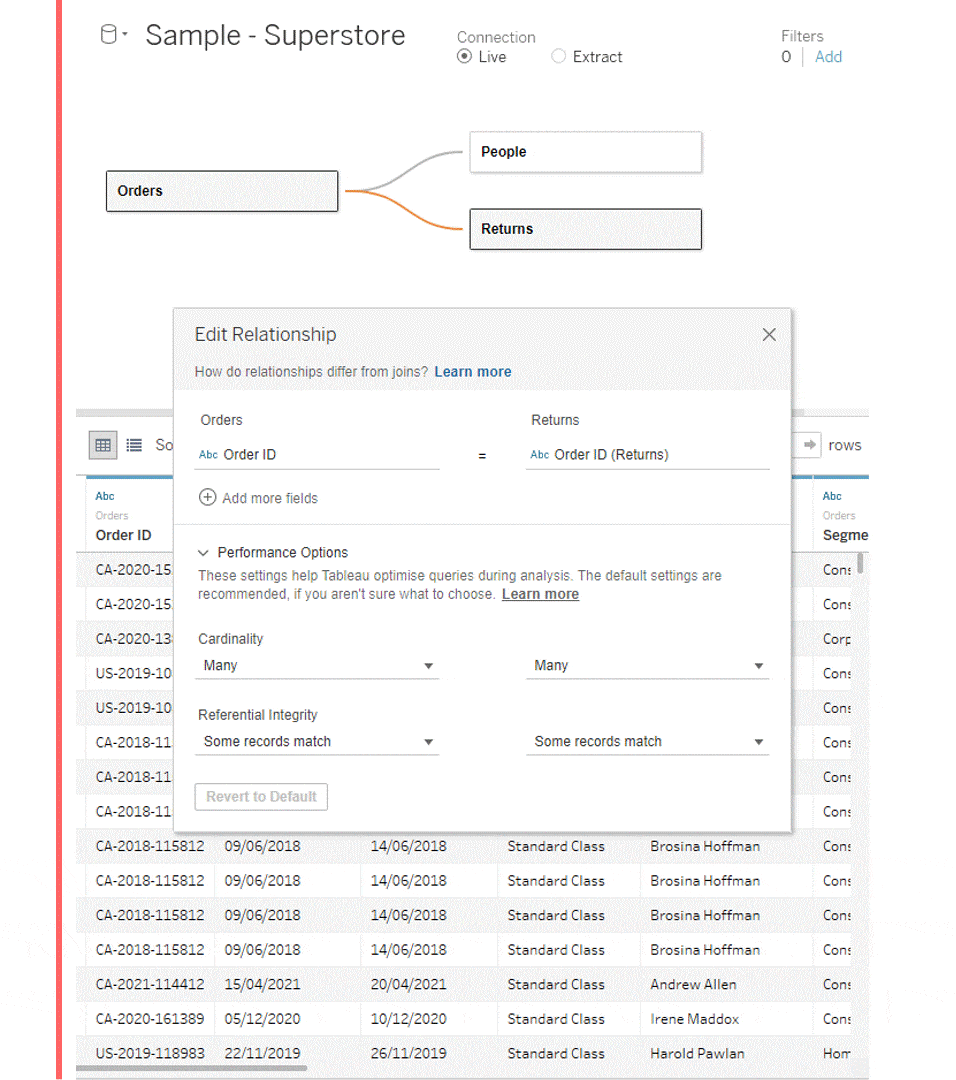
The features in there haven’t changed at all, but you may notice this new dropdown on the left of the grey area. A helpful gimmick to switch between different relationships and fields – that’s also the way back to the field list, apart from clicking on the logic tables above.
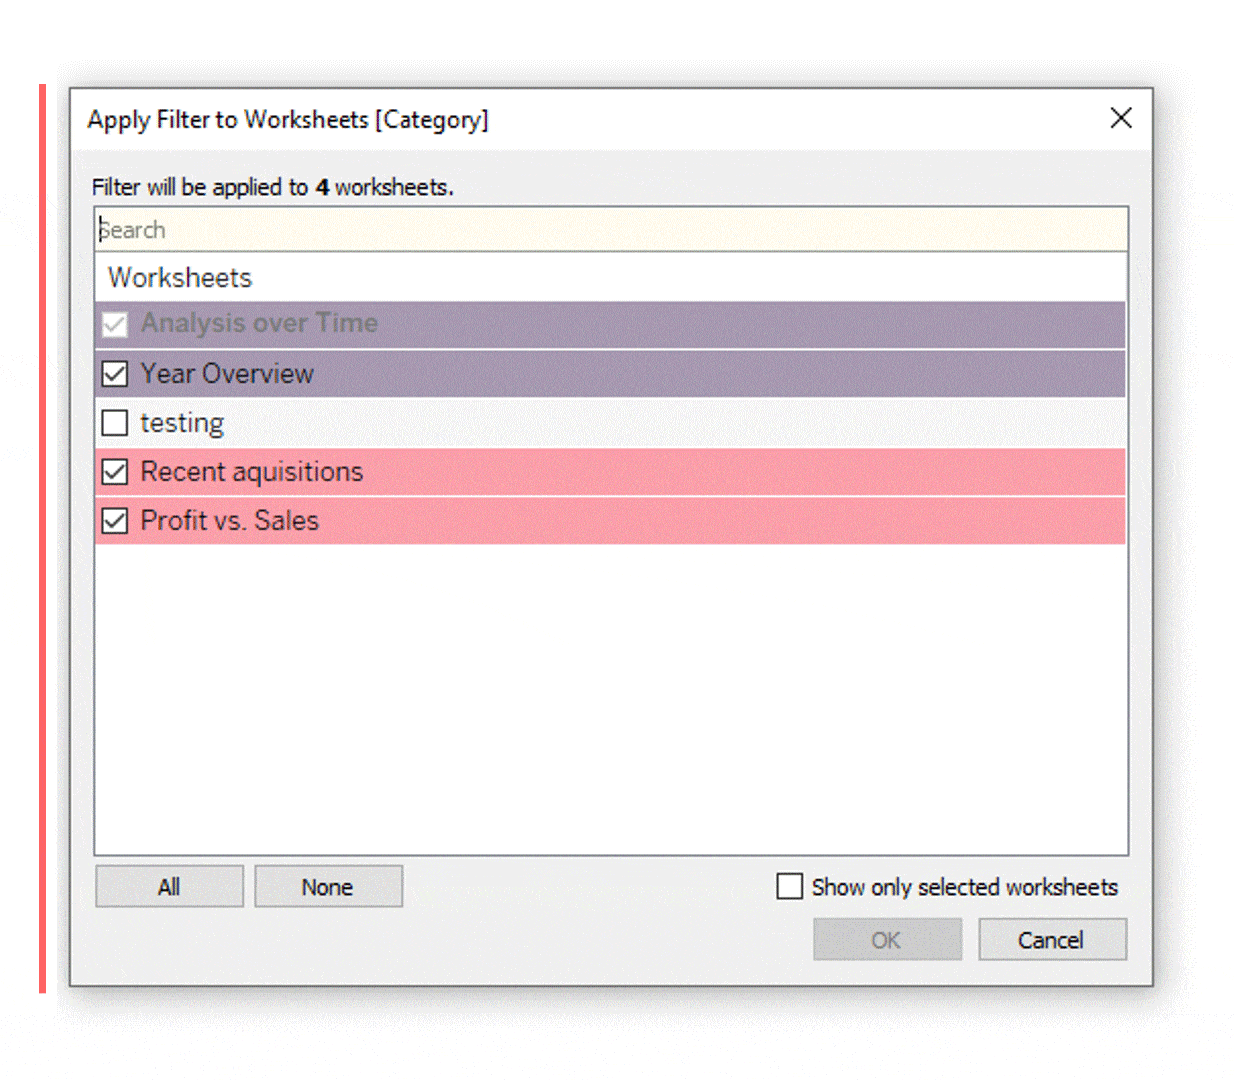
Color and Design Upgrade
This is more of a purely aesthetic change. A few (rather important) dialogue menus have been redesigned and now have a white background.
Filter for Selected Worksheets
The new look has been cleaned up, and fortunately, the color coding was kept. Also, the search bar looks more like a search bar and the All and None buttons became a checkmark at the top:
Actions
The Actions management became whiter and cleaner as well, while the old look was designed in different grades of grey:
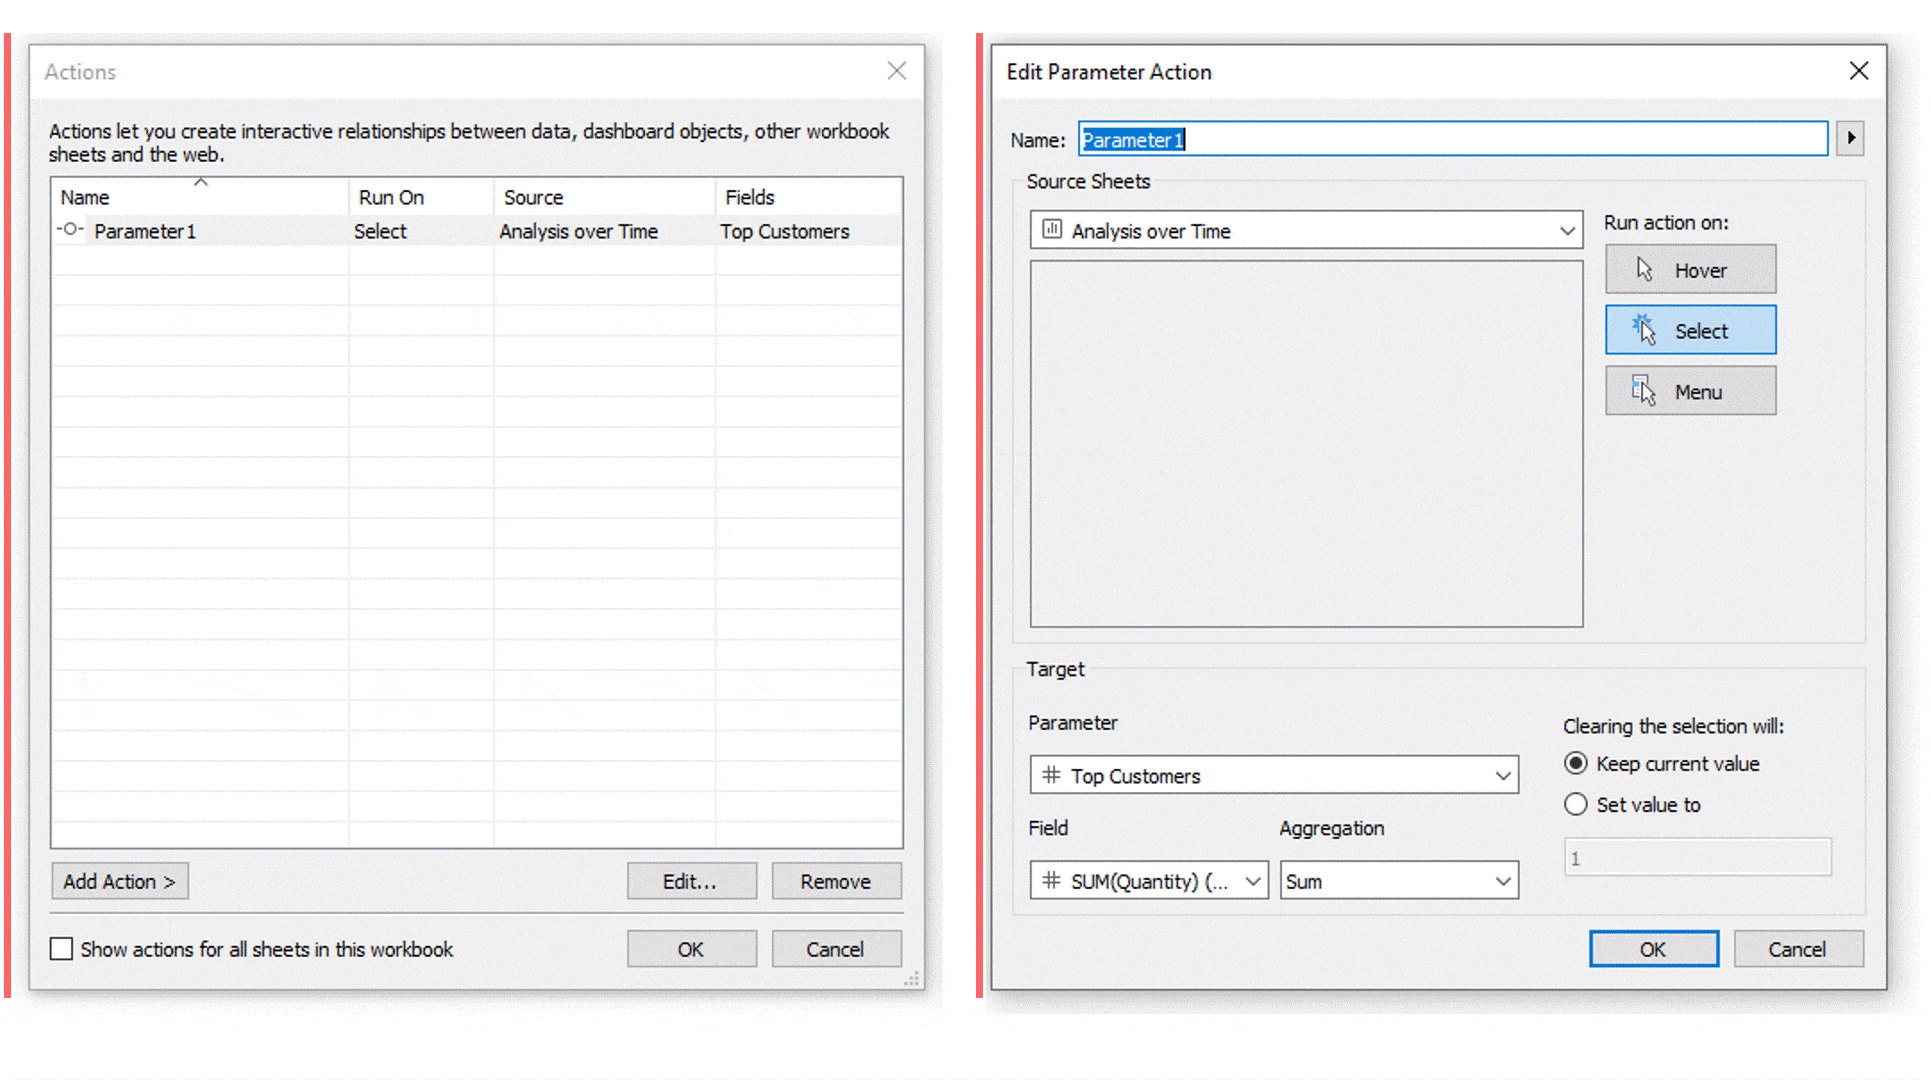
While the actual action settings are exactly the same, only clearer in appearance, the action overview’s checkbox at the bottom transitioned to two radio buttons at the top.
In Search of More Hidden Treasure
If you have found other tiny things that have changed in this latest release, please let me know! I’d love to add them into this post to capture all of the new updates.