
Recently, we hosted a webinar that focused on the anchoring question of, What is data prep and what tools can help me with it?
“The goal is to turn data into information and information into insight” – Carly Fiorina, CEO of Hewlett Packard
We feel like this is everyone’s goal—anyone who is doing statistical analysis, data modeling, visualizations or reporting on data. You’re trying to gain insight into what that data is trying to tell you. Raw data inherently doesn’t have that information; you have to work with it, shape it, clean it and create calculations to really gain the insight from it.
Data Prep as the Key to Insights
The focus in this blog is how we move our data through to information and then to insight. This is where data prep comes into play. Here are some of the typical challenges/scenarios we see people facing:
- Data Engineering/IT has given you your data, but it’s not quite right for what you’re hoping to do.
- You don’t have a Data Engineering/IT team.
- Data preparation is a very manual process for you.
- Your Tableau connections are full of joins, blends or custom SQL.
- The number of LODs within Tableau is bogging down your workbooks or becoming unsustainable.
If any of these problems/scenarios speak to you, we recommend that you keep reading. We’ll look at how you can make your data prep efficient, repeatable and actionable, and we’ll discuss the tools that can help you do that.
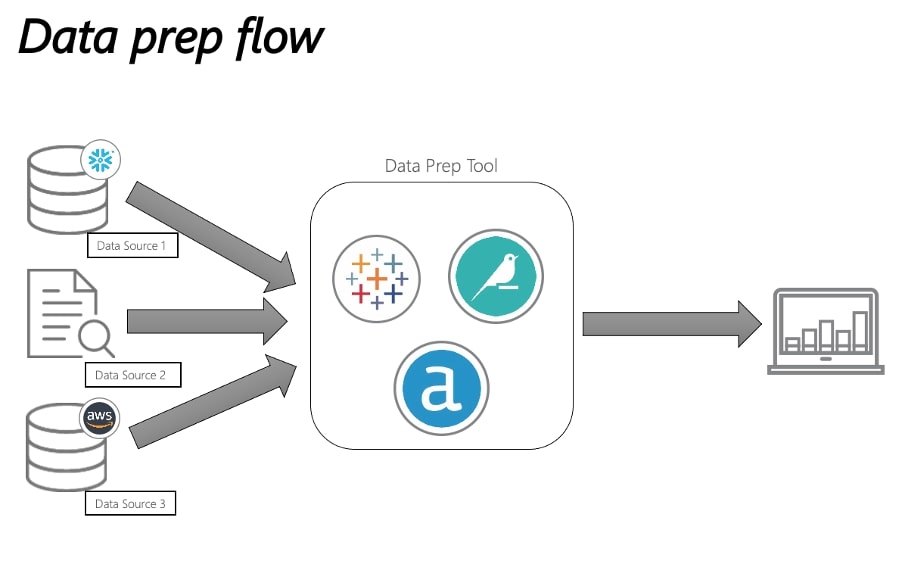
Let’s review this typical data workflow with three unique data sources. We’ll be looking at the three tools we see as being at the forefront of the data prep landscape: Tableau Prep, Dataiku and Alteryx. Let’s look at the things you should be thinking about when you compare the three of them.
Understanding the Difference Between ETL and Data Prep
Before we get deep into the review, let’s discuss the difference between ETL (extract, transform and load) and data prep. We hear these two terms intertwined and although they do have similarities, we want to make the delineation between the two of them.
ETL (Extract, Transform, Load)
This process is extracting the data from multiple sources (typically different types of data) and transforming it, so this is shaping the data, creating calculations and finally loading it into an often-large data warehouse. This tool is often utilized by Data Engineering/IT teams and completed at a company-wide level.
Data Prep
More recently reframed as the “last mile data prep”, this is the prep before the visualization. Typically, this tends to be more customized and is often utilized by individuals or groups of data scientists, business analysts and data analysts.
So, when deciding between the three solutions above, it’s important to assess your answers to these questions:
- Who do you want to use the tool and workflows?
- Individuals? Teams? Are you sharing across teams? If so, how many?
- What data sources are you interested in, and where do you want the data to go?
- When do you want the data prep workflow to run?
- Scheduled? When you push a button? Run from an API?
- Where do you want the tool to run?
- On premises? On the cloud? On your local laptop?
This is by no means an exhaustive list, but it’s a starting point.
We’re going to delve into the tools now and take a look at each of them working on the same process and how they each arrive at the desired outcome:
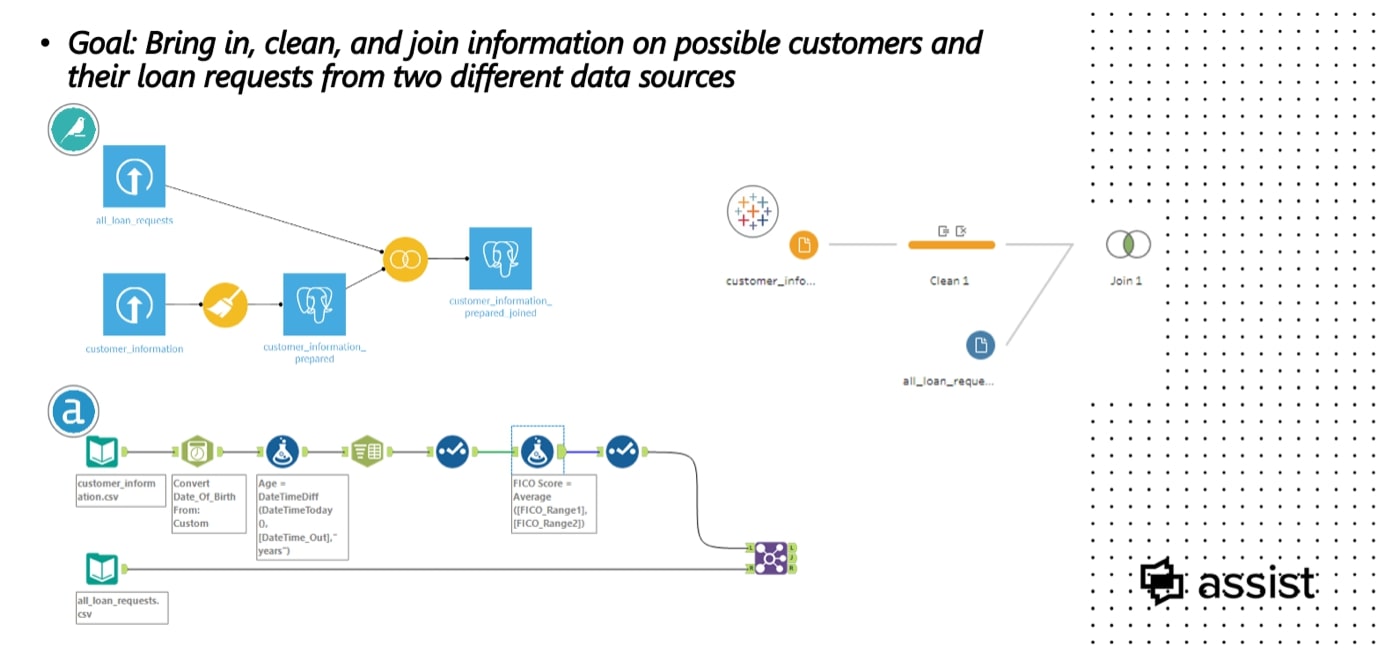
We’ll be working through the tools as we have seen them work with clients. In this instance, we will run through the tools as if we were a bank working with two different data sources:
- All Loan Requests – What the loan request entails, an ID for customer, amount, how long it’s for and other credit agreements.
- Customer Information – The personal details on the clients
The goal is to bring the information together and conduct data prep on these files before importing into Tableau.
Scenario 1 – Tableau Prep
Tableau Prep is Tableau’s own tool, so if you are a Tableau user, the interface will be extremely familiar and is just as intuitive as the tool itself. Tableau Prep, like Tableau, has so many native APIs that you can select to connect your data. We love this feature.
Step 1 – Bring in the data sources:
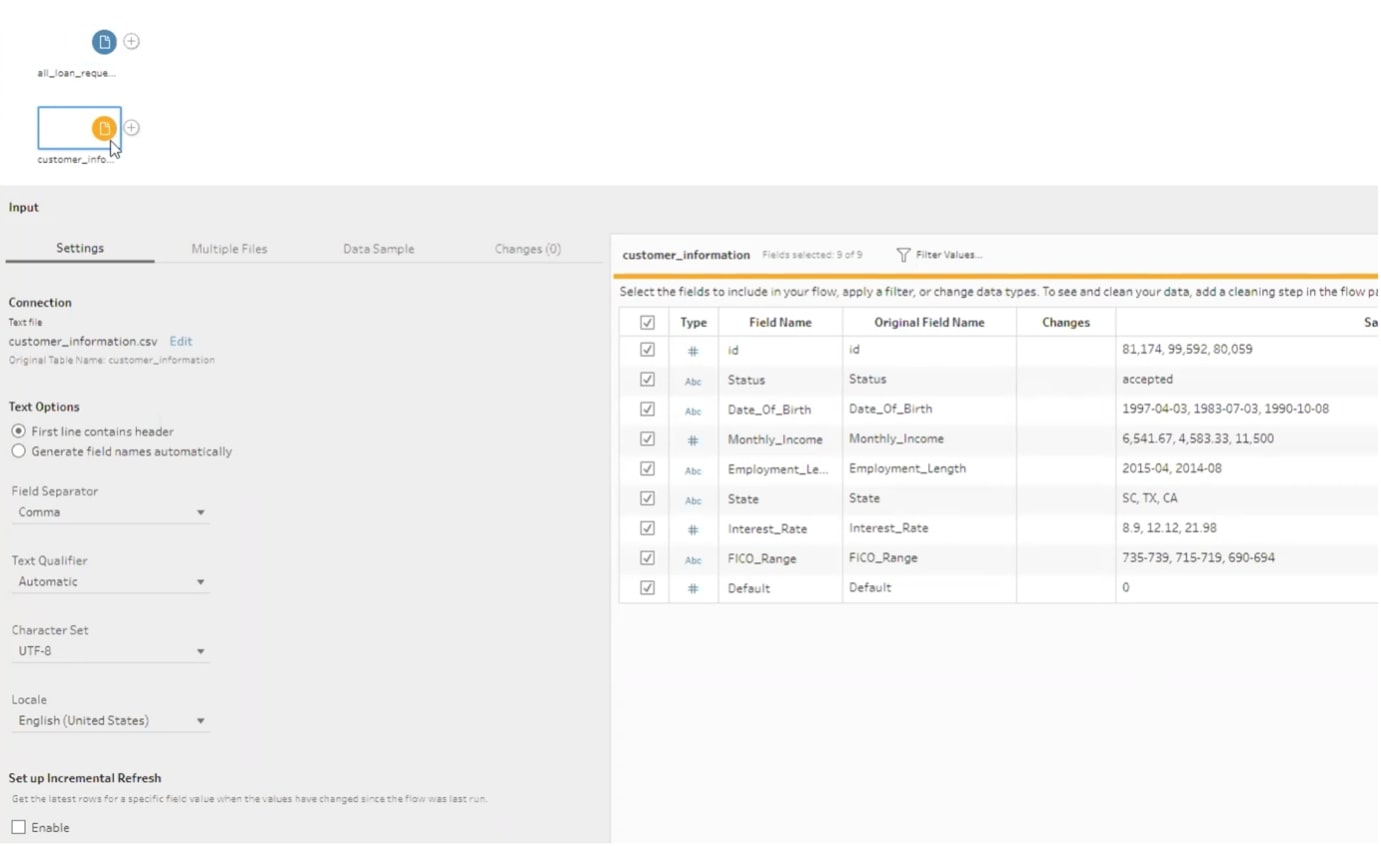
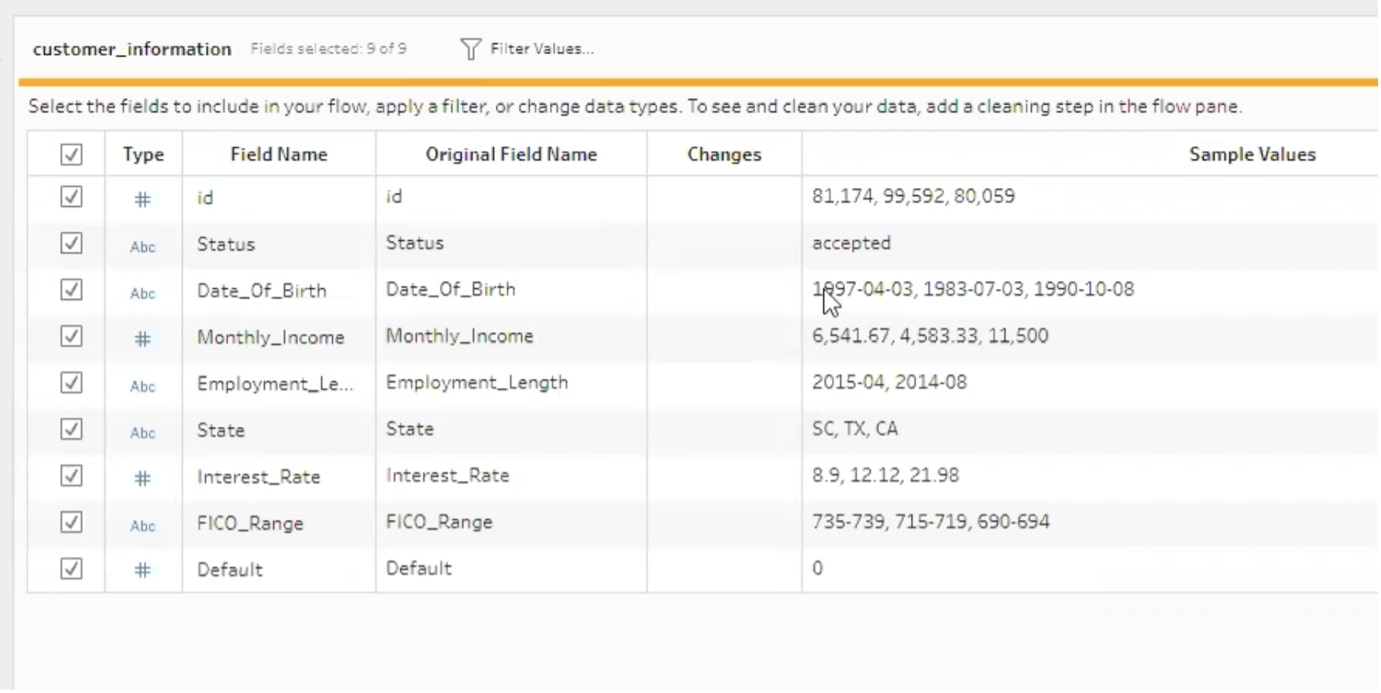
Step 2 – Review the data imported in the summary screen:
Step 3 – Perform calculations:
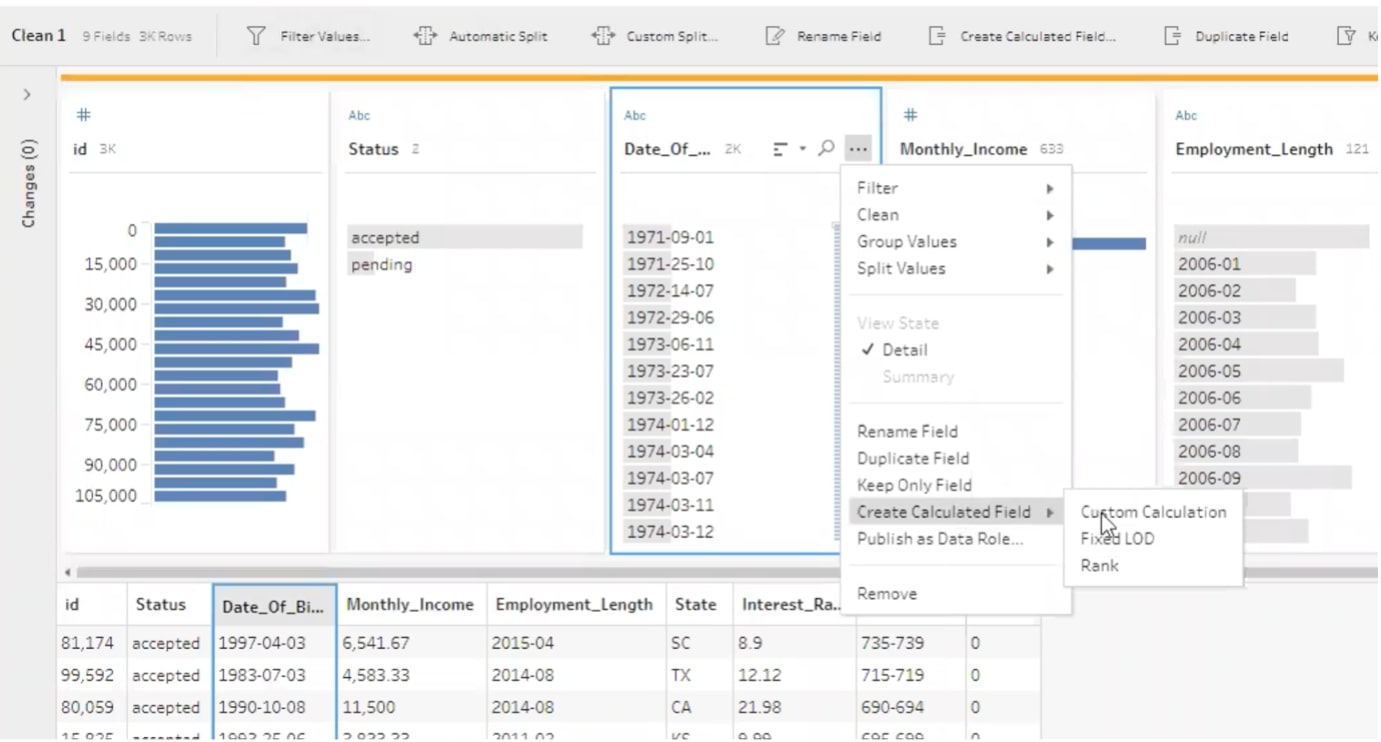
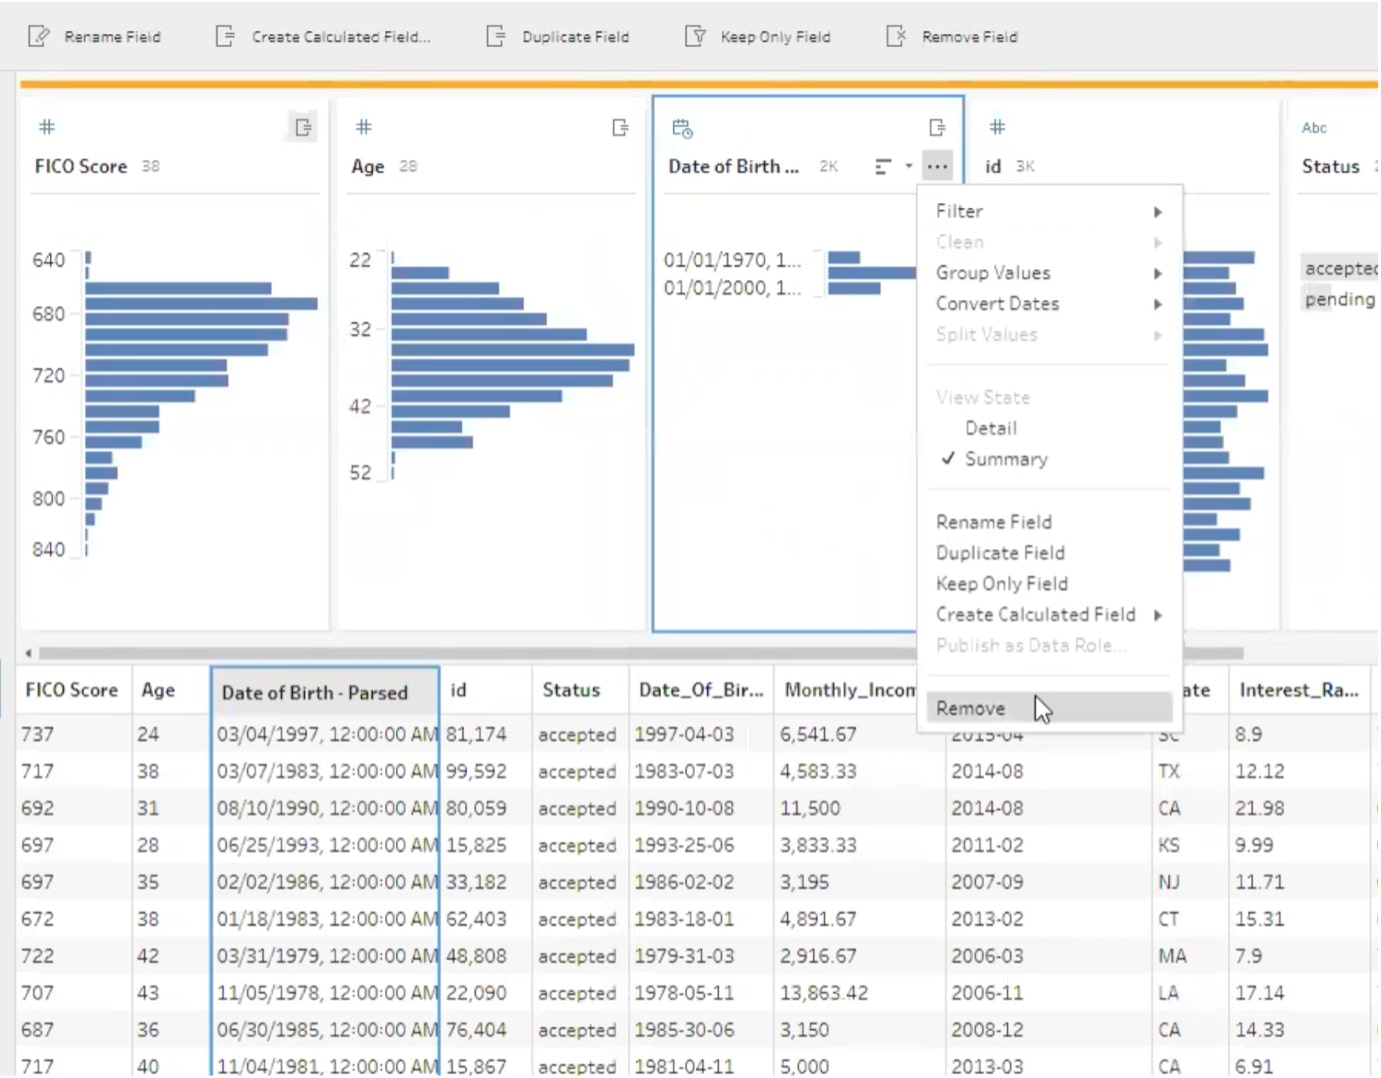
In this instance, we can see that Date of Birth will come into Tableau a little messy, so we are going to use DOB to calculate an actual age for our customers.
Step 4– DOB calculation:
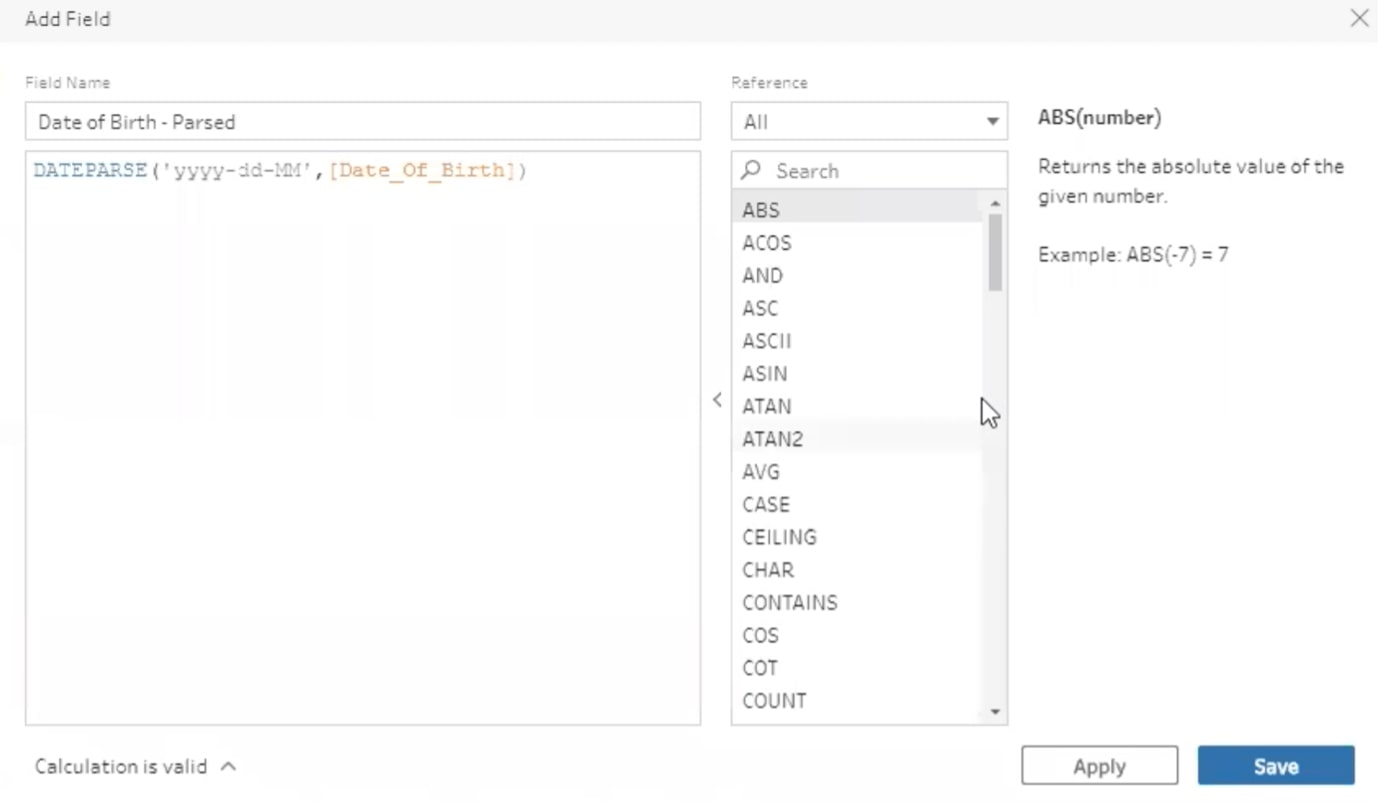
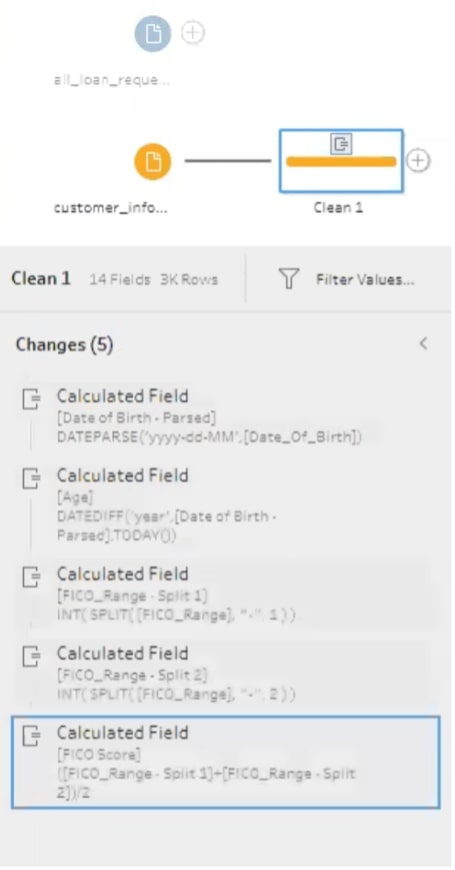
You’ll recognize this calculation field if you are currently a Tableau user. Essentially, you’re taking the calculation out of Tableau Desktop and doing that work in Tableau Prep, so when it comes to using Tableau Desktop, that work has already been done:
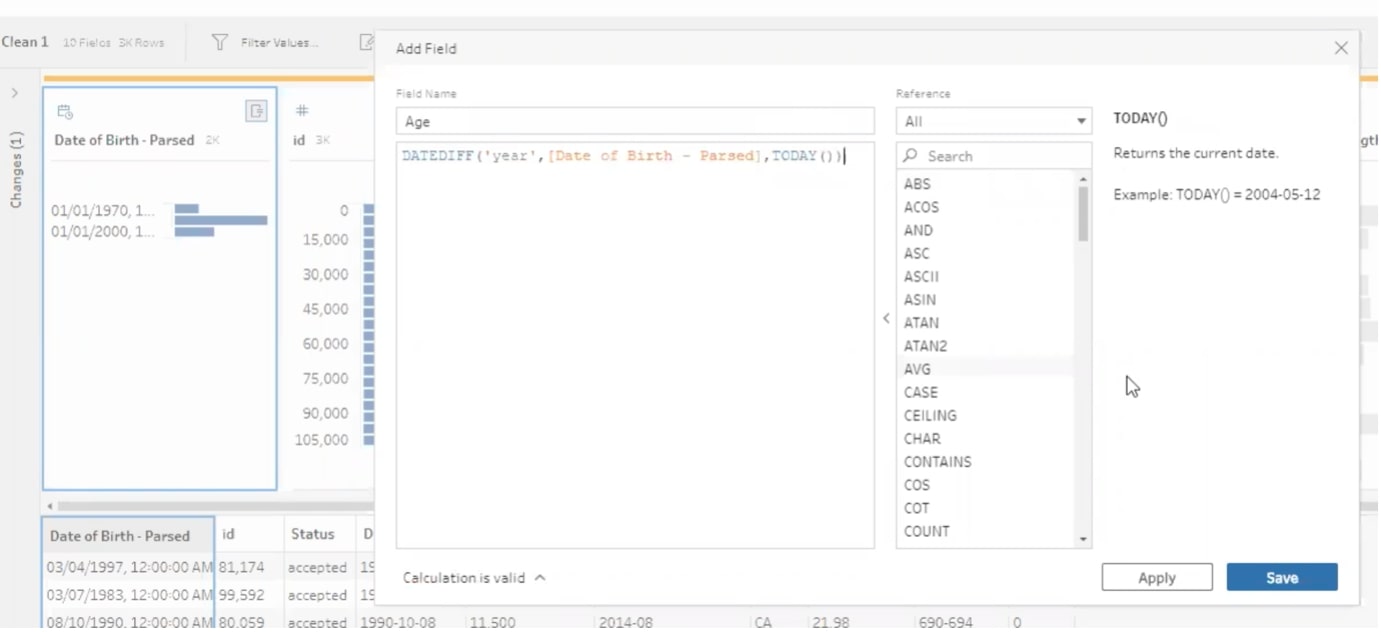
Now that we have the parsed field, we can create a calculation looking at DOB from today’s date to calculate an individual’s age:
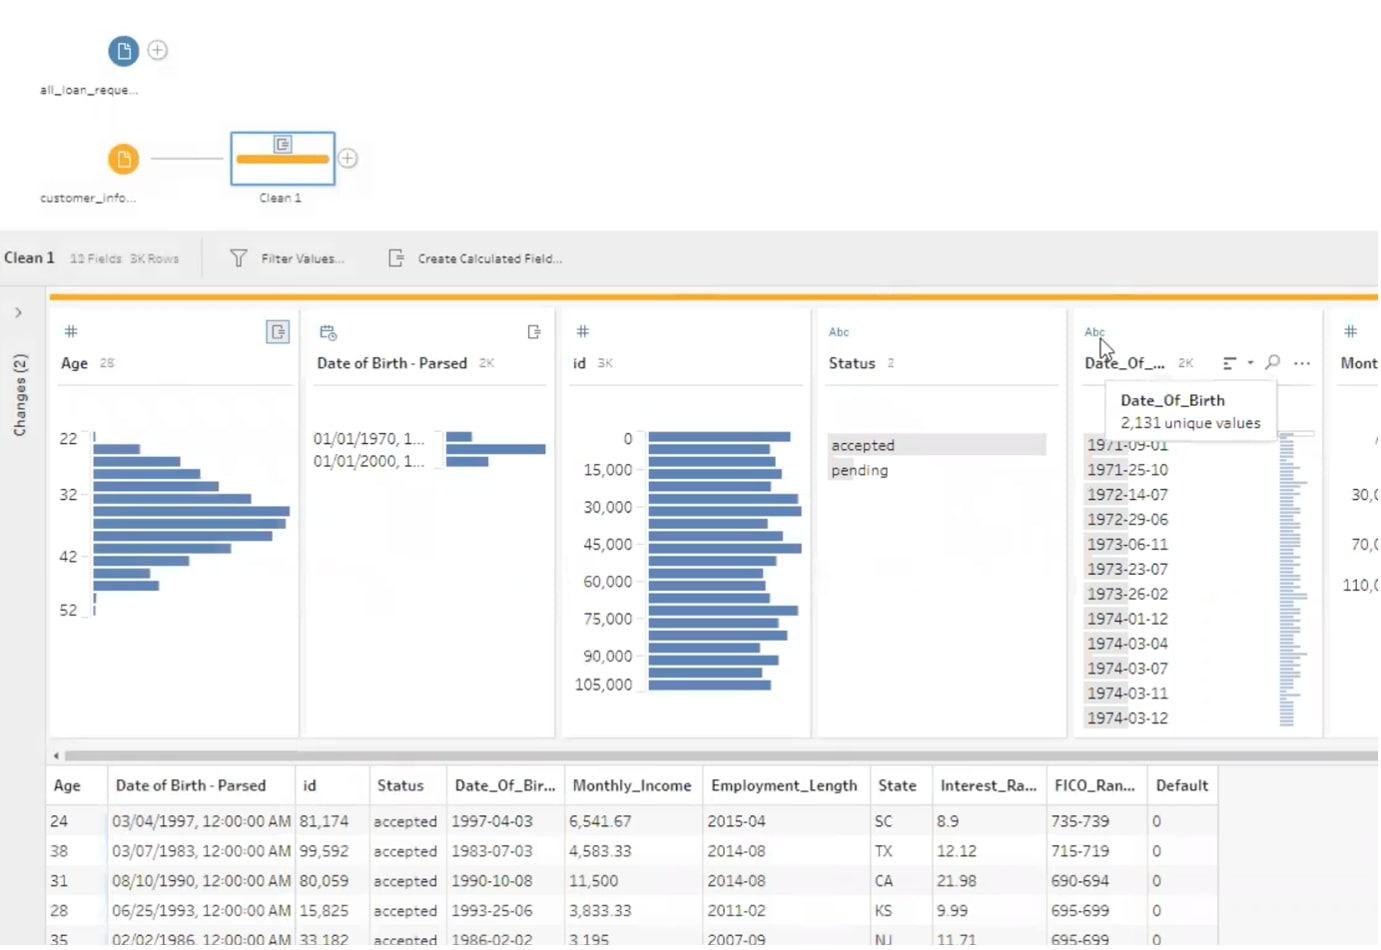
All of the prep you have completed is easily identified on the screen, so if you want to make alterations or just have a record of what work has been done, it is available for you to review:
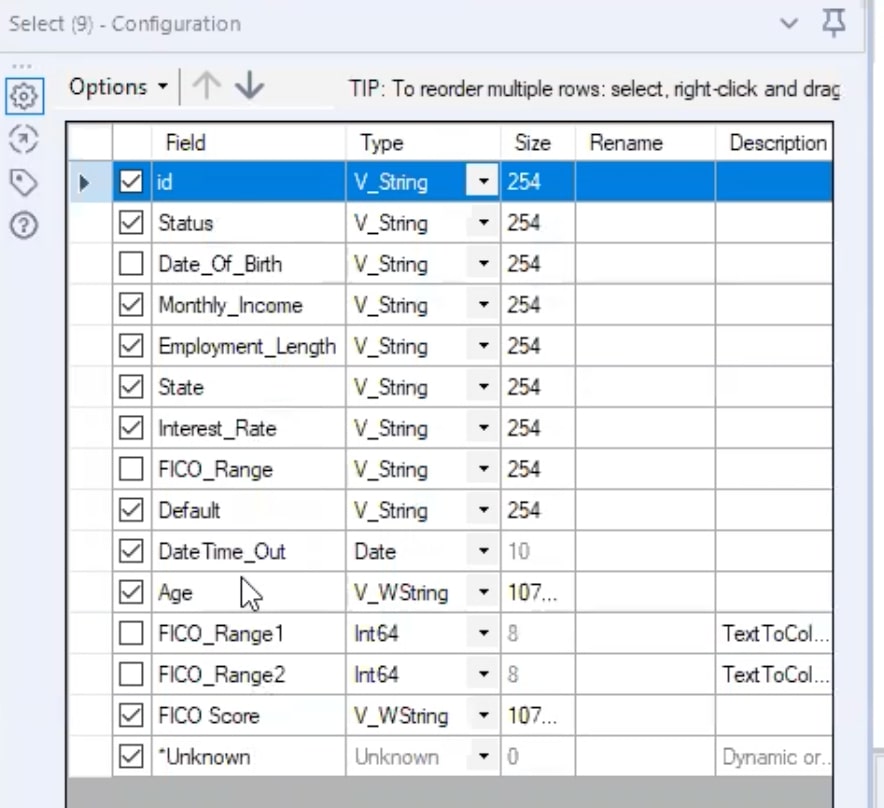
The final step in the data prep is to remove data you don’t wish to carry through. Taking all of the data into Tableau Desktop could lead to the performance lag of your visualization, so it’s better to remove it prior to the import:
Step 4 – Join:
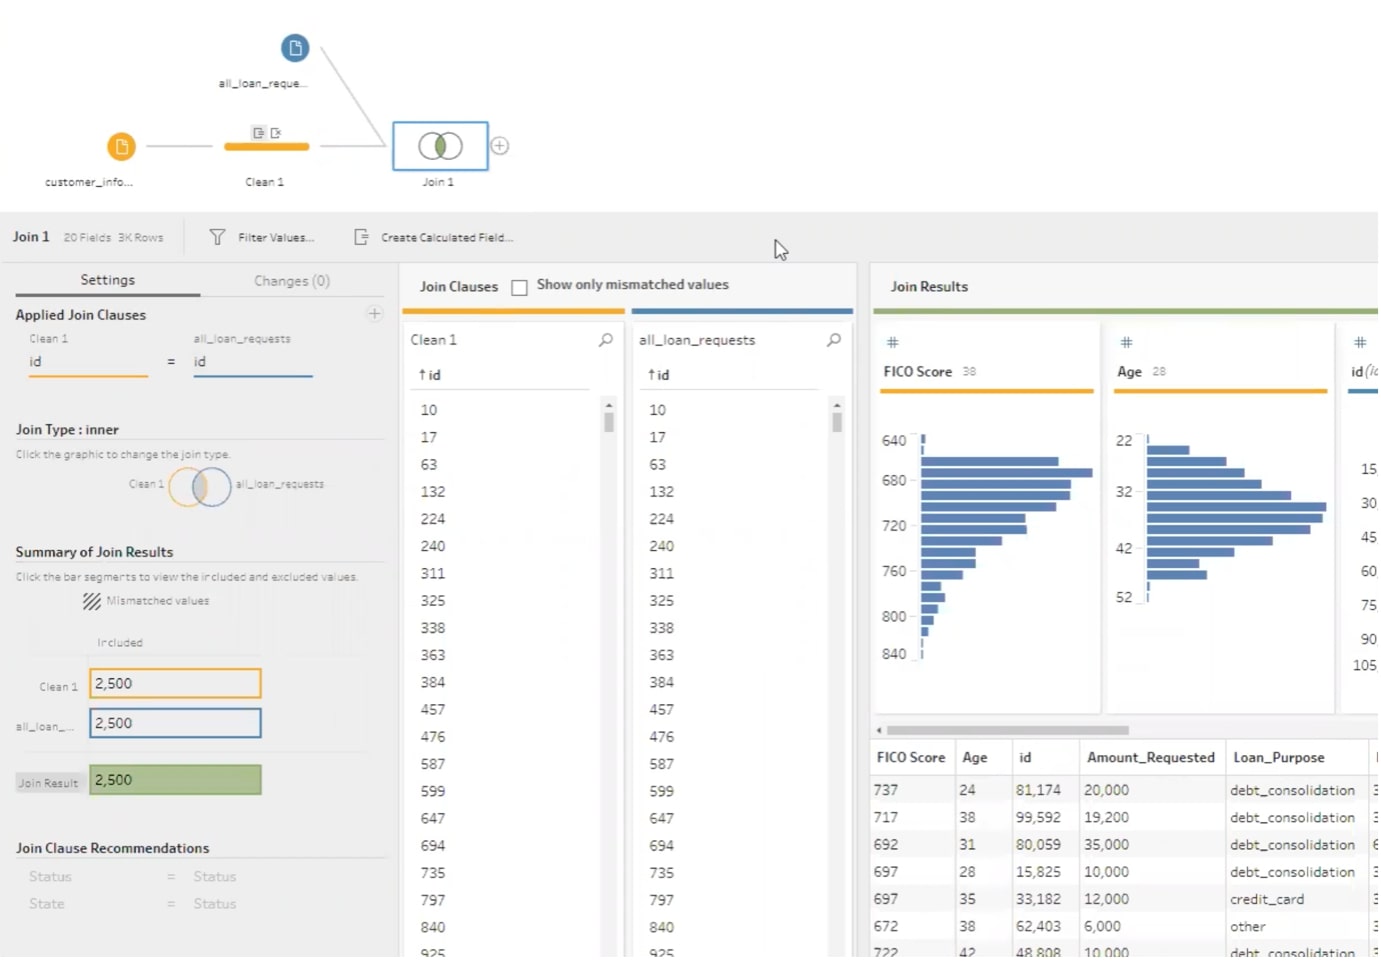
Finally, we create the join. In good, old Tableau fashion, this is a simple drag-and-drop action and selecting the type of join. Due to the ID column, this is done efficiently. You can then output the data and decide the type of file you wish to export to.
Scenario 2 – Dataiku
Let’s take a step-by-step walk through of exactly the same actions, but this time, we’ll perform them in the cloud-based Dataiku tool.
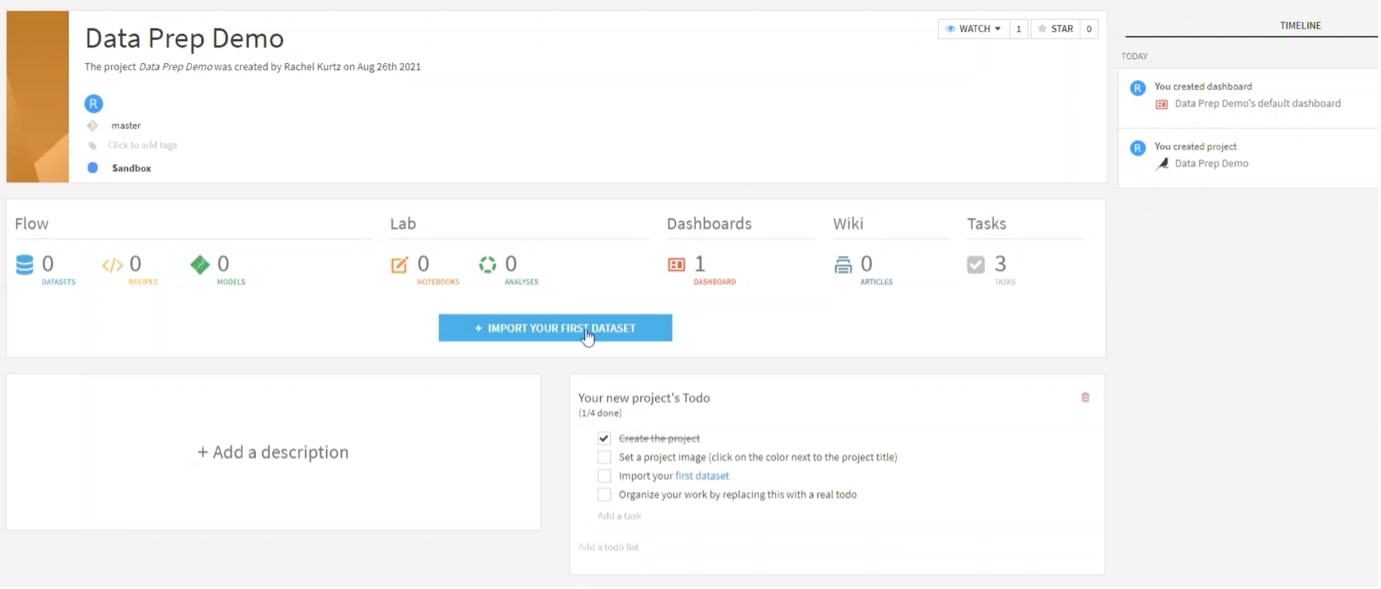
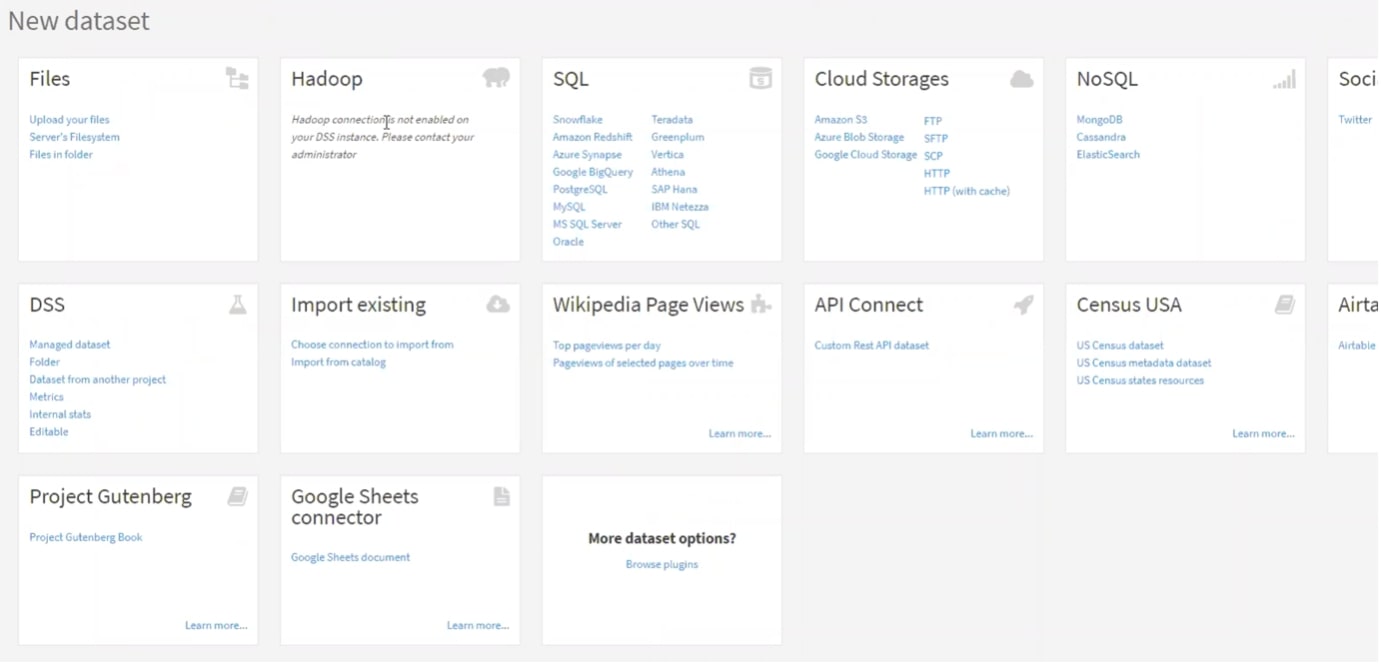
Step 1 – Import the datasets.
Step 2 – Similar to Tableau, you have an array of native APIs to choose from:
Step 3 – Select your recipe:
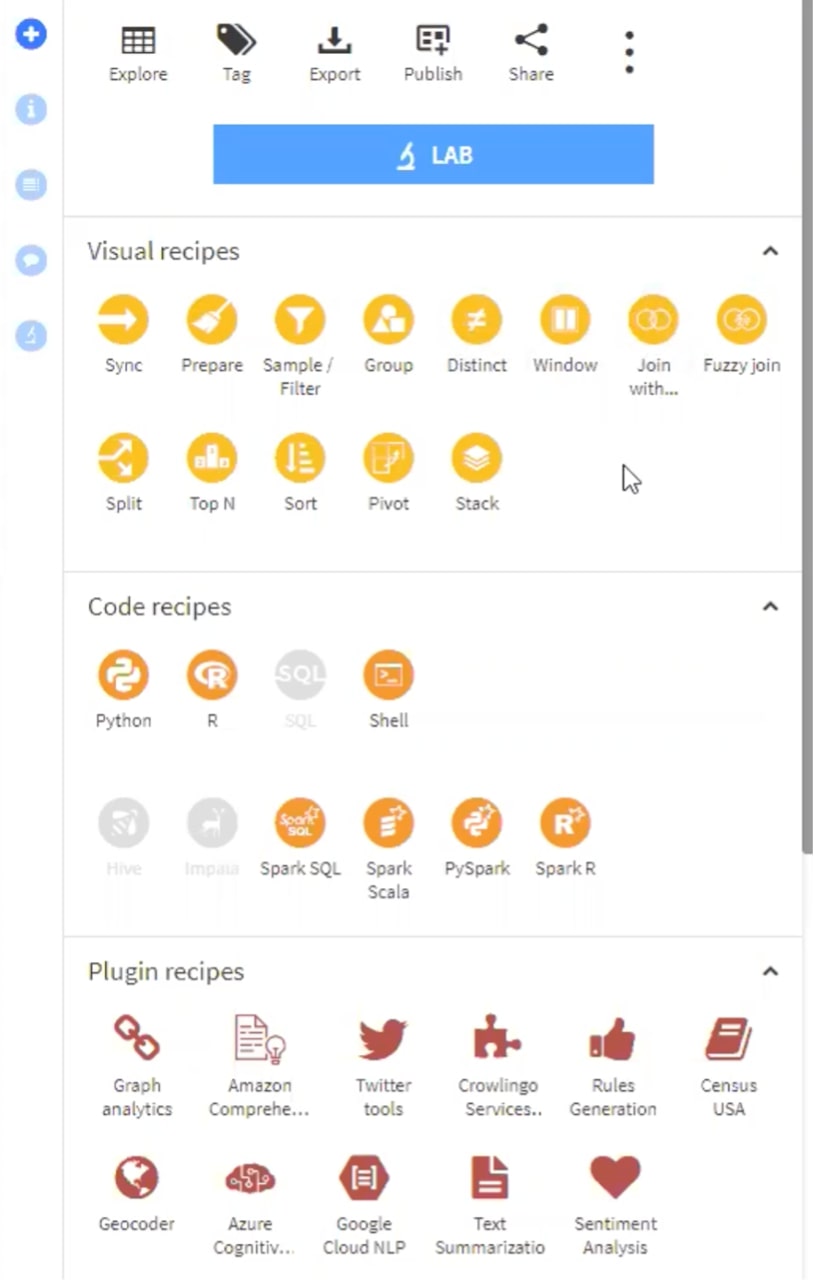
Tableau calls these “steps” but in the Dataiku tool, we have recipes. The Visual recipes are pre-written for you, Code recipes allow you to write your own code, and Plugin recipes are external sourcing you can use. We are going to be working with the Visual recipe Prepare.
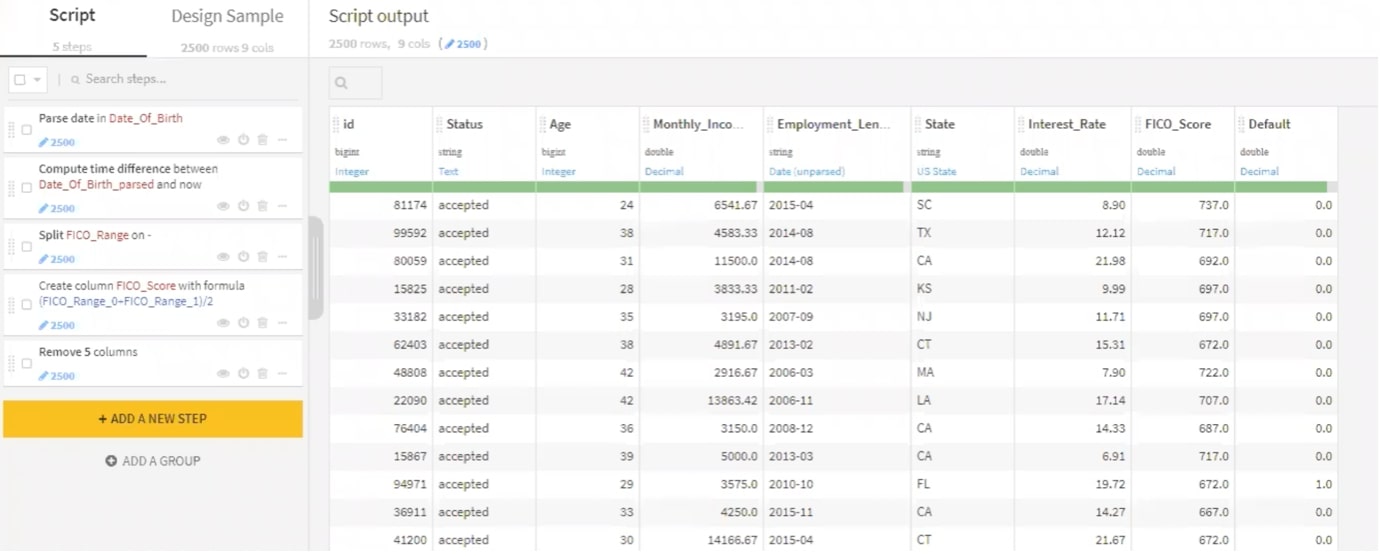
Step 4 – Clean your data with calculations:
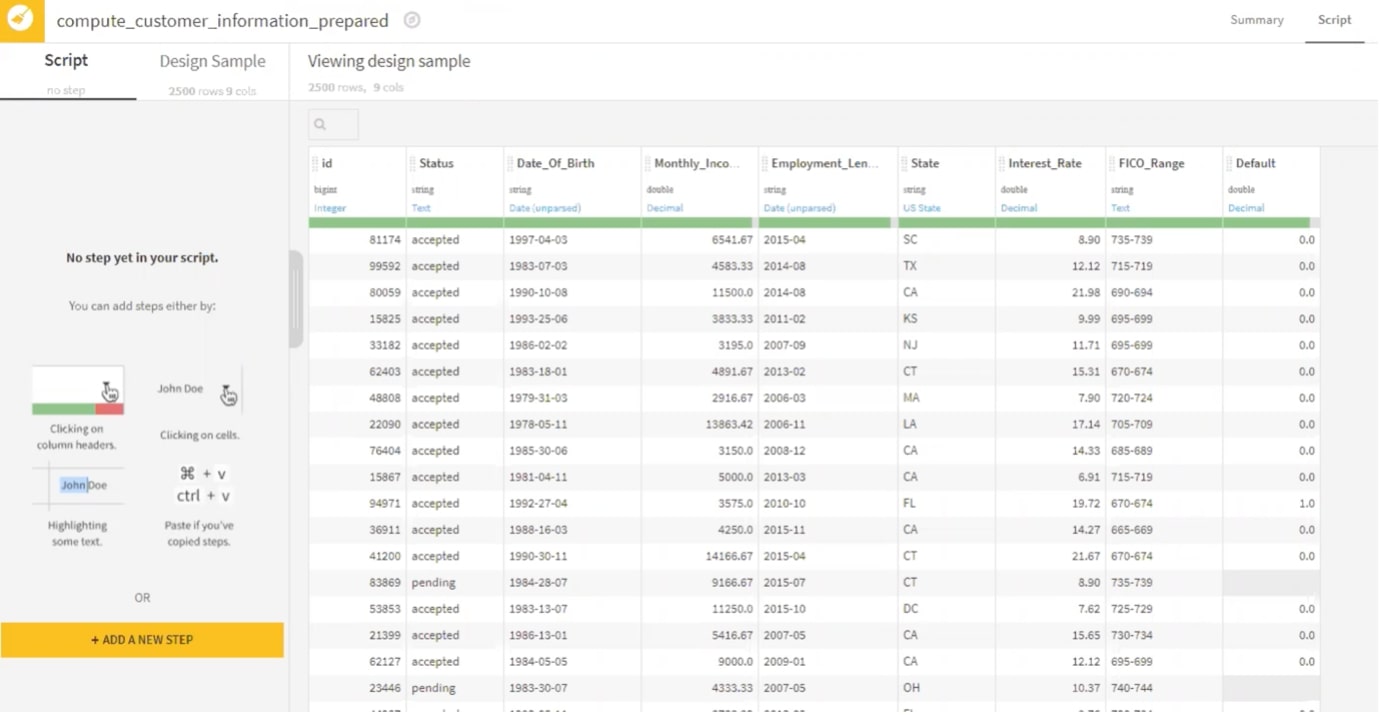
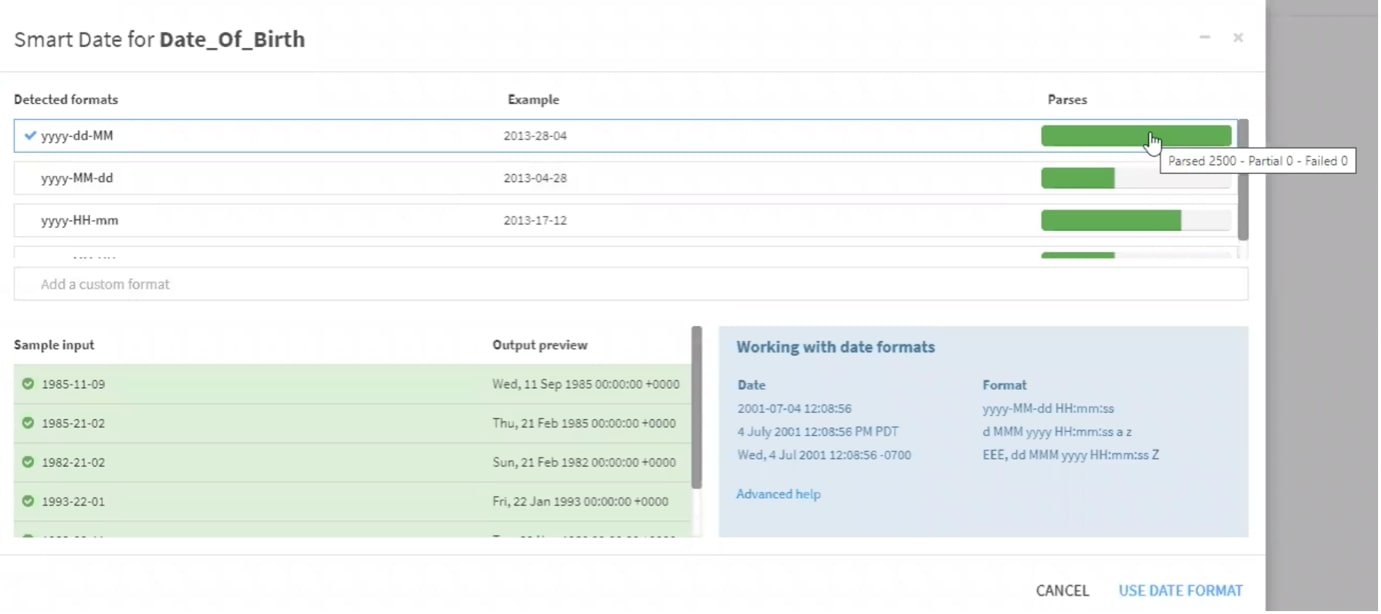
Dataiku is prompting you to parse the data, goes on to show you the recommended format and identifies how much of your data will be impacted by the parse.
Once again, Dataiku has recorded all of the work that has been done to complete the last mile so that you can review:
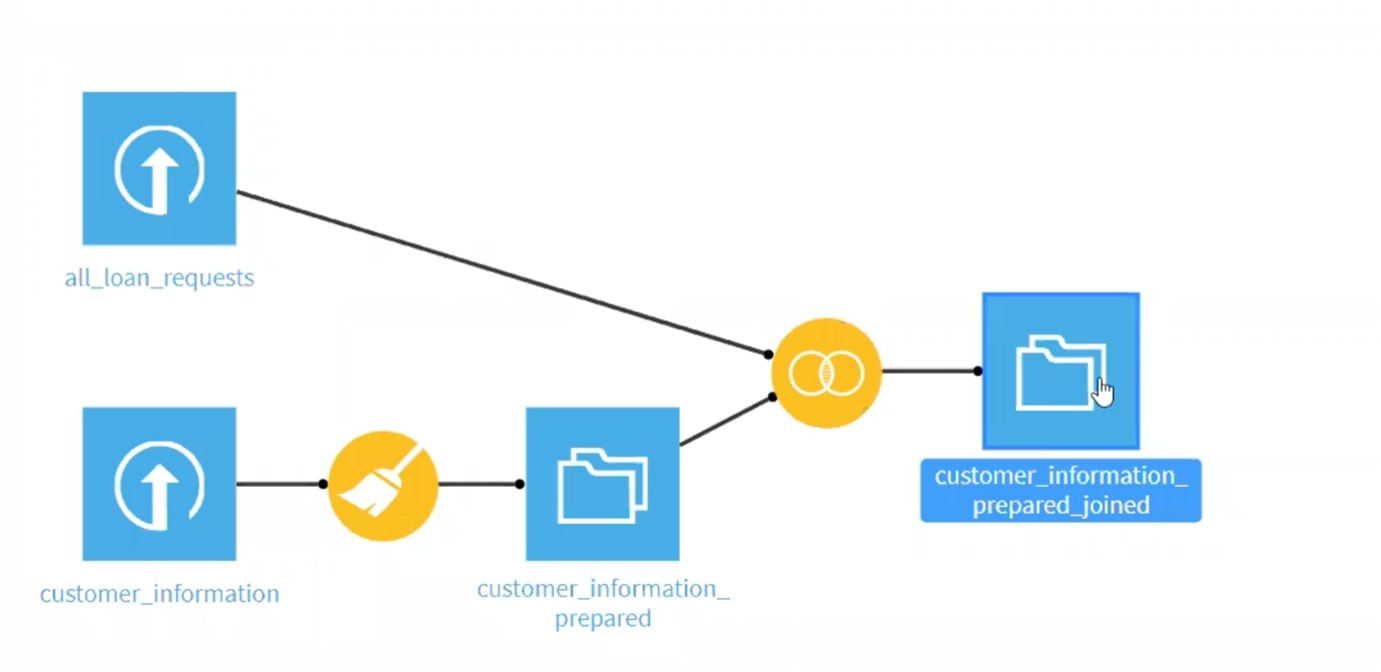
Step 4 – Joins
Finally, using the visual recipe card, you want to complete the join:
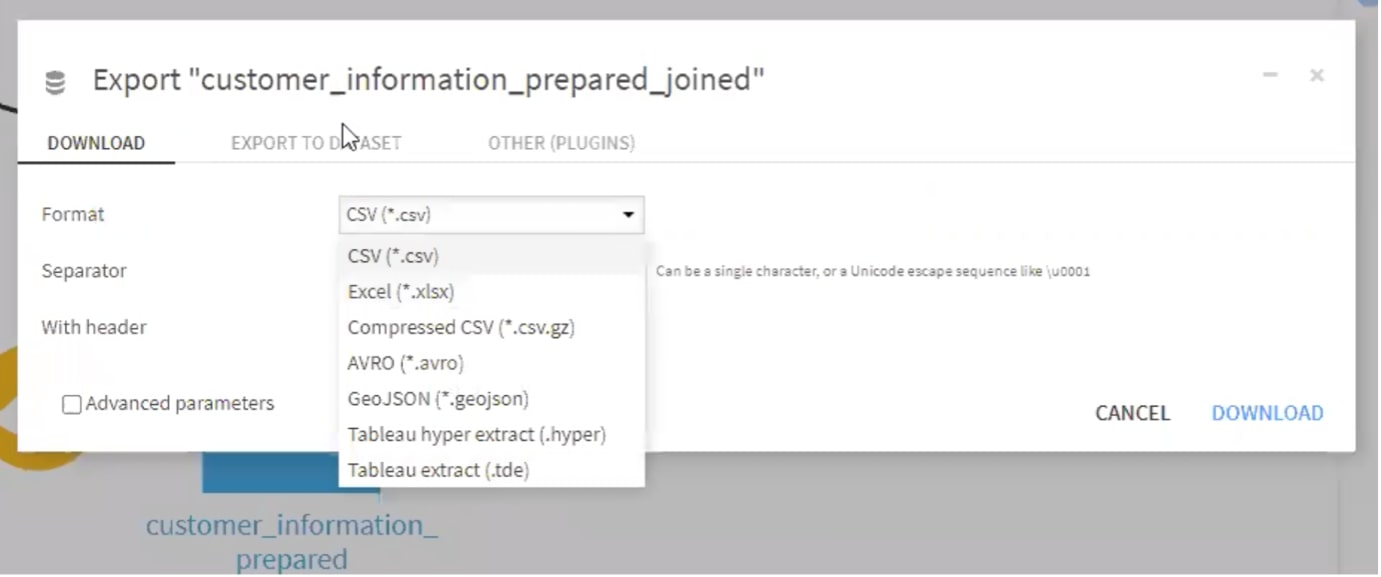
Step 5 – Export:
Scenario 3 – Alteryx
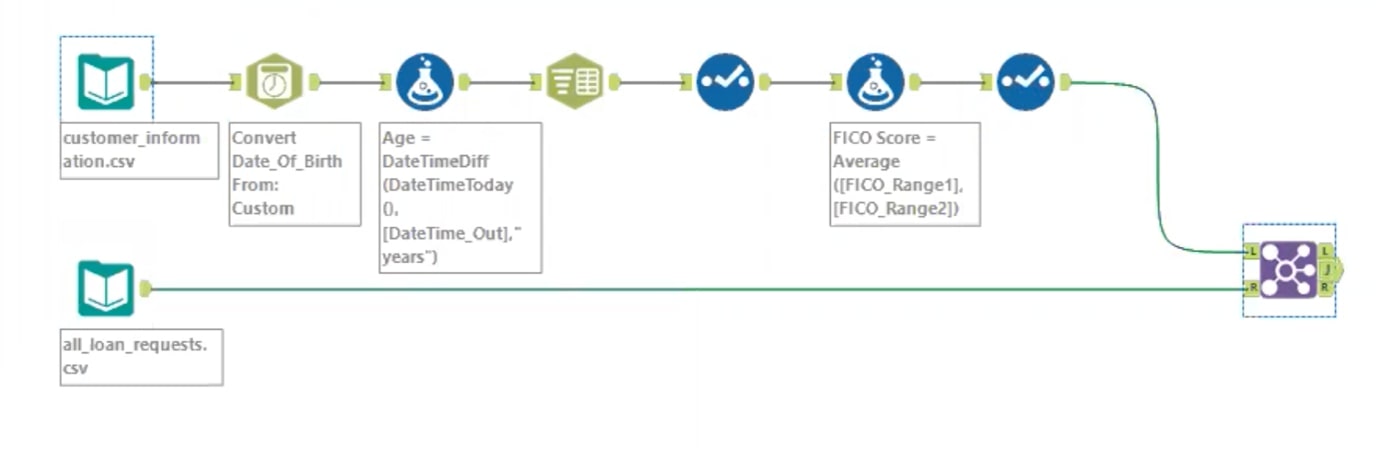
Finally, let’s move onto Alteryx. Where Tableau and Dataiku like to group things together, Alteryx requires you to do these steps individually and has a far more detailed workflow on the canvas.
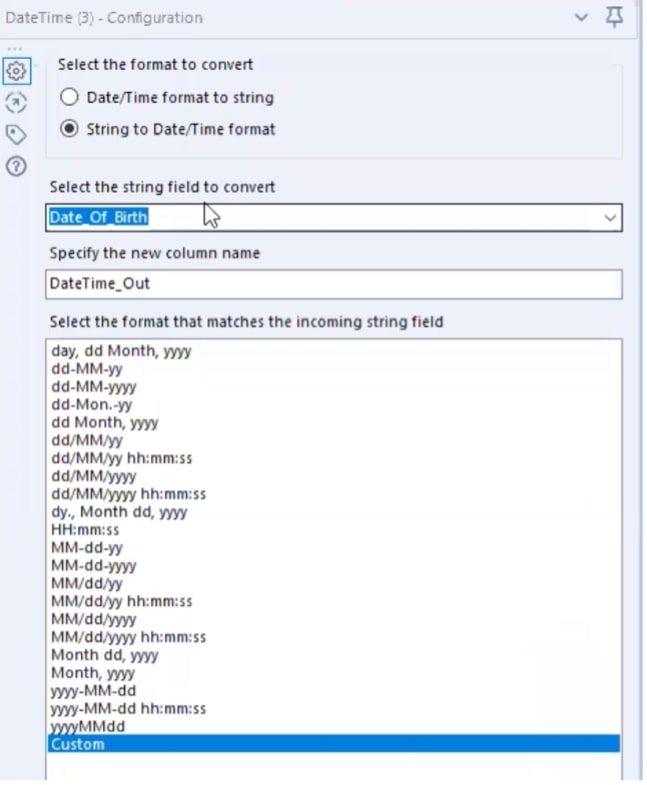
Step 1 – Parsing the DOB:
Step 2 – Create your calculation:
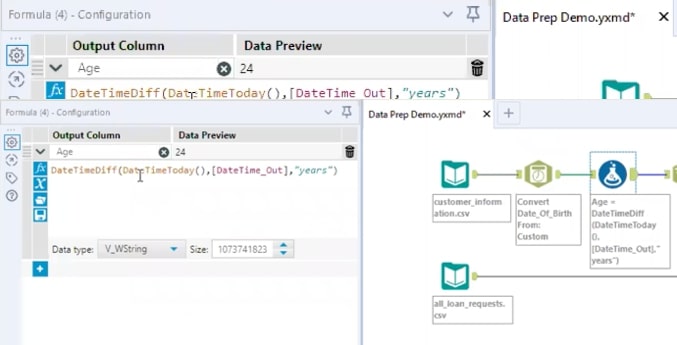
Step 3 – Create your formulas:
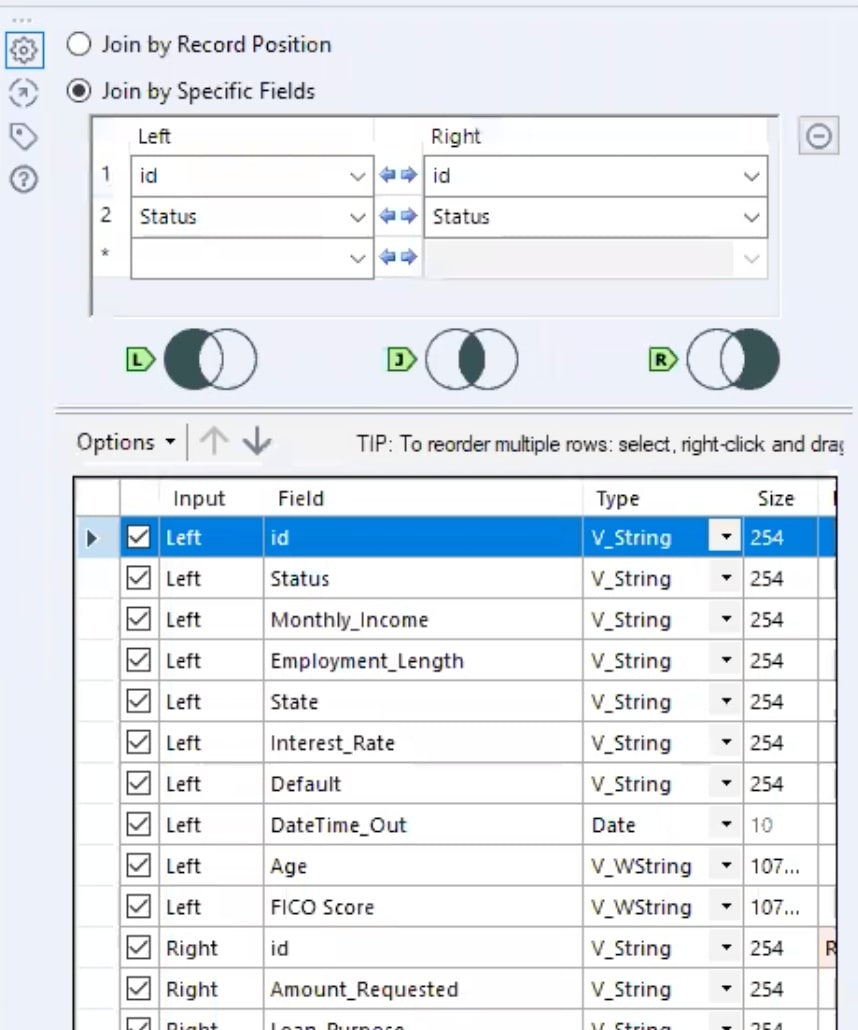
Step 4 – Join your two datasets:
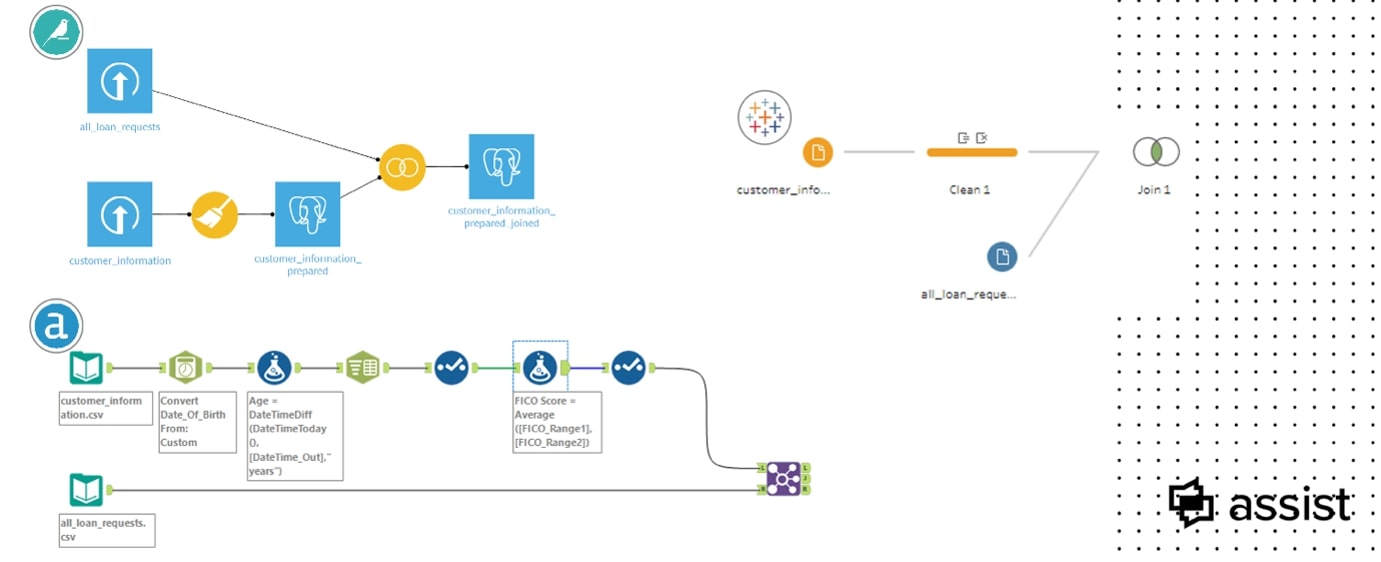
Here is your final, detailed data prep:
And here is a look at the workflows by tool:
Next Steps After Data Prep
Now that we have prepped our data, what do we do next?
Immediate Success!
- Get to your answers quicker – you no longer have to ask your IT team to support any data changes/fixes.
- Visualize things quickly and effectively – you’ve done all of the hard work before you bring this data into Tableau.
Future Success!
- Data Science
- Prediction, classification, customer segmentation
- Native options within Dataiku and Alteryx
So, which tool is right for you? It really depends on your immediate actions/requirements, as well as what you see yourself doing with your data in the future. If you want support reviewing those considerations or want to discuss the different tools with a guide who is well versed in them all, feel free to contact us! We’d love to help you make the best choice for your use case. And check out the webinar recordings below to watch the full walkthrough of the scenarios above.
Webinar Replay – US
Webinar Replay – APAC
Webinar Replay – EMEA