
The year 2020 provided new, and at times harsh, perspectives on the ways we go about our lives. In light of this, InterWorks used the holiday season as an opportunity to examine what matters most. As a result, our CEO, Behfar, had the idea to donate to chosen non-profit organizations around the world on behalf of our employees. After selections were made and data was collected, we challenged our three BI interns to come up with compelling stories to tell in Tableau. We asked Kelsey, John and Ben to briefly reflect on the data stories they wanted to tell and the holiday donations effort as a whole.
A Story of Impact
Ben Calder
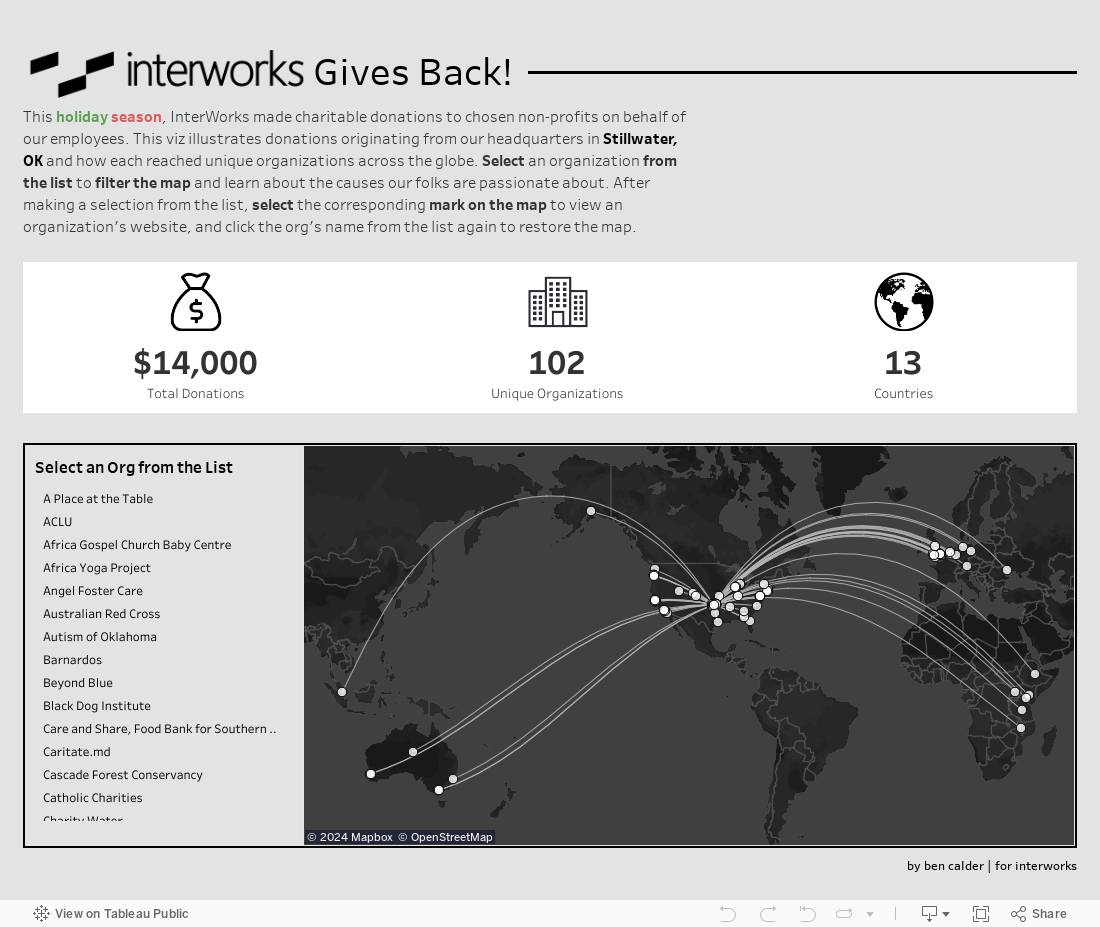
I was once told by a colleague here at InterWorks that data visualizations are only as effective as the stories they tell. There are plenty of acceptable strategies when it comes to deciding what that story is, but the story itself should be priority #1 and crystal clear to your audience. The story I wanted to drive an audience towards with this data viz was the global impact resulting from actions taken in Stillwater, OK—InterWorks’ Global HQ.
I thought for a while about which visual or visuals I could incorporate to highlight this information while making Stillwater a key component. I knew that our people were spread across many areas of the world, so I started scraping geographic data to see where the organizations were located. This subsequently landed me on an article about origin destination maps. This visual is most effective when you want to show a myriad of outcomes originating from a single geographic location. This was perfect because, though our people are dispersed around the world, our heartbeat is in Stillwater. The resulting dashboard is one where an audience gets a unique picture of how a tech consultancy in Oklahoma positively contributes to global causes.
Walking the Walk
During my time at InterWorks, I have learned the power of a promise. Behfar talks about the idea of using our talents here to truly make the world a better place. Certainly over the last year, many of us may have taken action to do just that. Through InterWorks’ ongoing work with non-profits, the clients we serve and this recent donations effort, I see us delivering on that promise to make the world a better place. There is always more to be done, but the dollars contributed to these organizations seems like a great place to start.
Check out my viz below:
A Story of Purpose
Kelsey Frank
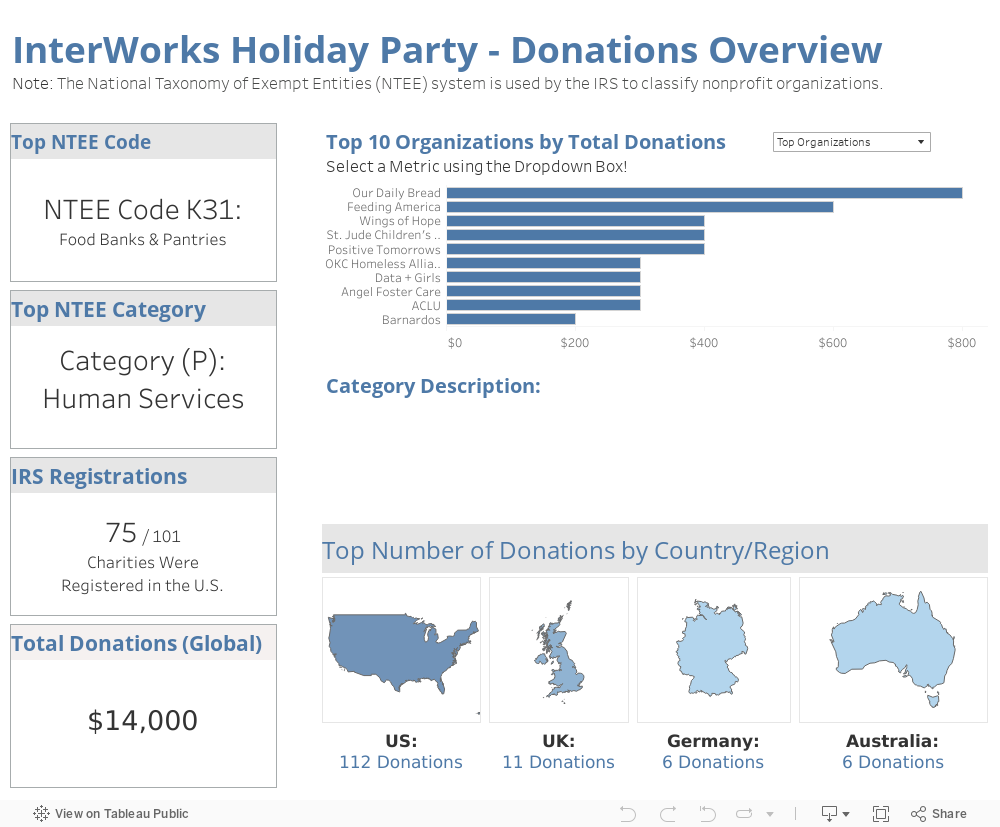
What is the purpose of a story? To inspire action? To garner interest? A single set of data can be used to generate an almost infinite number of stories, a principle which is clearly expressed through Ben’s, John’s and my distinctly different dashboards. In a year rife with misfortune, the story I wanted to tell focused on the types of charitable causes closest to our hearts. In order to better understand the types of nonprofit organizations InterWorks employees donated to during the holiday season, I gathered data based on a classification system known as the National Taxonomy of Exempt Entities (NTEE). Utilized as a means of classifying nonprofit organizations by the Internal Revenue Service (IRS) and National Center for Charitable Statistics (NCCS), the NTEE system assigns alphanumeric codes based on each organization’s primary service(s). By compiling this data and transforming it into a visual format via Tableau, I hoped to allow viewers to better understand what types of charities received the most interest and support as we closed out this memorable (i.e. chaotic) year.
Where We Stand
While a certain pandemic may have forced everyone into varying degrees of isolation, our ability to make a positive impact on those around us still remains. While working for InterWorks, I have been repeatedly surprised by the never-ending generosity and drive the InterWorks family seems to devote towards making a positive difference in the world. From working hand-in-hand with various nonprofit organizations to donating time and money to charity, InterWorks truly stands behind its people, clients and work.
A Story of Influence
John Moss
Setting in on this project, it became apparent that this was one of my first chances to take a dashboard from start to finish by myself. Having recently changed positions to BI Intern here at Interworks, I felt that this was going to be an excellent opportunity to learn from my fellow interns and have a chance to test the skills I had learned over the last six months.
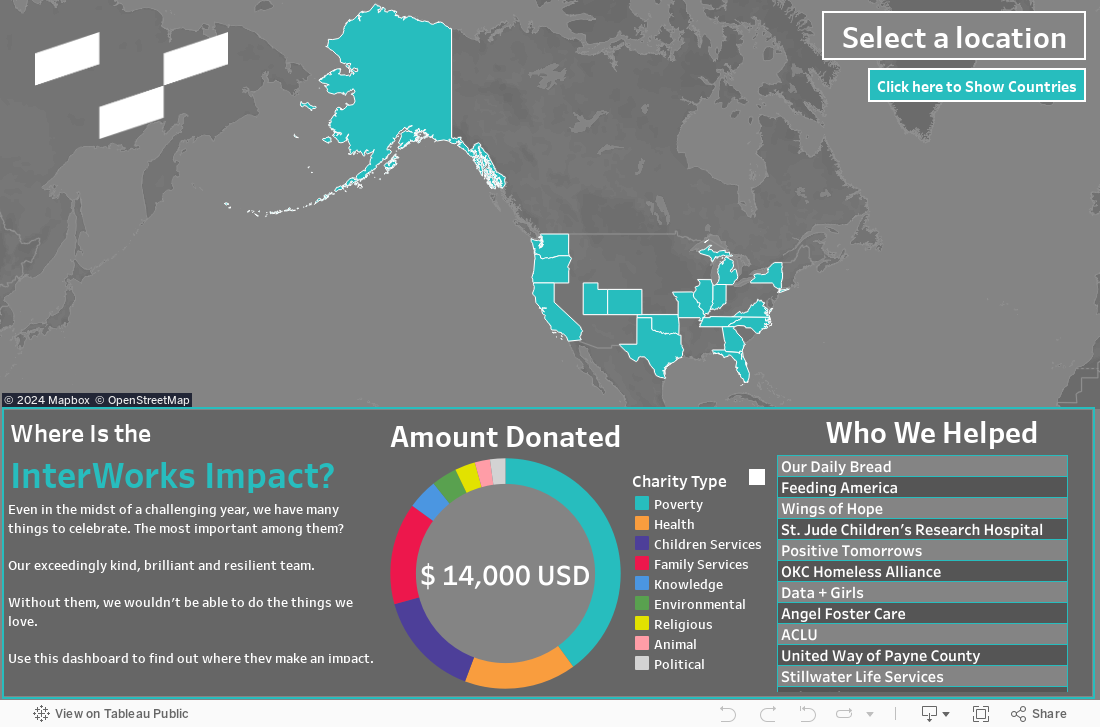
As the rest of the intern team mentioned, I felt that this dashboard needed to do an excellent job telling the story of how InterWorks impacts the world. To do this, I decided a map was essential to demonstrate how far we, as a company, can reach when we come together as a team. Following the map, I wanted the dashboard user to be able to dig deeper into not only where the charities were but also the types of charities and the total USD amount donated. This two-part idea gave birth to the donut chart we see as the dashboard’s primary KPI. Finally, I wanted the user to take a more in-depth look at an individual charity. Creating the organization list, I used dashboard actions to filter only the charities in a selected region. From there, a user can click on any charity and visit their website for more info or to donate.
Aside from functionality, design is something I have always prided myself on. I started my term at InterWorks as a marketing intern, and I have continuously tried to find ways to let that skillset shine through. With this dashboard, I aimed to make a very clean-feeling dashboard while also incorporating the InterWorks colors. Using our internal style guide and some marketing instincts, I was able to create what I think is a very sleek UX that also provides a bit of InterWorks branding.
InterWorks’ Personal Impact
Over the last year and a half, there is one main thing I have learned from Kelsey Lee, our intern coordinator: InterWorks is an organization that is interested in using an individual’s strengths to accomplish not only the organizational goals but also the individual’s personal goals as well. For me, this exercise was a shining example of that idea and shows how InterWorks makes an impact on its own people.
Let’s Tell Your Story
Check out each data viz as each does a great job telling this unique story. We hope that this perspective challenges you to contribute to causes you care about or even one of those we have chosen. As always, feel free to reach out to us if there is anything we can do to help support you on your data journey.