It is late summer 2020, and I, like many others on the West Coast, am currently surrounded by wildfires and glued to various online web maps showing the various states of the world burning down around us. Here in Portland, I have the Clackamas County Wildfire Evacuation Zones on constant refresh as to view not just the extent of the fires, but also to know if I or nearby friends/relatives need to evacuate:
Of course, as an analyst, I cannot help but want to get this data and visualize it in my tool of choice. In my case, I am particularly interested in tracking the location of the most recent active fires detected by satellite. I want to dig just a little deeper than the web map allowed me to, and I would love to bring this data into Tableau.
Lucky for us, in Tableau version 2020.2, Tableau lets you connect directly to published web map data layers from ESRI’s ArcGIS.com (or ArcGIS Online), the platform where most of these public maps are hosted. This means we can easily grab this data and visualize it in Tableau. Let’s see how!
ArcGIS Web Maps
ArcGIS is a mainstay mapping platform used by many in mapping and GIS. Further, it’s used very heavily in the public sector, and a majority of government entities use ArcGIS to develop, publish and host geographic data and maps for public consumption.
Further, with its Living Atlas of the World, it boasts perhaps the largest repository of free and public geographic data available, much of it curated by authoritative agencies from all over the world. Yes, you can bring most of that into Tableau as well 😊.
There are many, many types of geographic data, but the data type of interest here is called a Feature Layer and is an ESRI format used to serve up geographic data in ESRI ArcGIS web maps. This is the type that Tableau will read.
How to Access the Layers
First, find the web map you want pull a layer from. Typically, in most publicly open ArcGIS web maps, you can click the layer of interest to find “more options” that eventually lead you to the service URL, which you will need to display the layer in Tableau.
In this case, I want to grab a layer from this US Wildlife Activity Web Map hosted in ArcGIS. The data sources are governed and curated by experts, so I feel good about using one of these data sources in my analysis. In my case, I want to use fire detection data (i.e. Thermal Hotspots) observed by the NOAA’s VIIRS satellite. I’m sure to seek out metadata for my layer, so I fully understand critical details around the data source.
From the ArcGIS web map:
- Find the desired layer in the ArcGIS Online web map, and click More Options
- Under More Options, click Show Item Details
- In the Show Item Detail page, scroll down to URL
- Copy the URL
Add the Feature Layer in Tableau:
- In the data source section, click To a Server
- Find and click Esri ArcGIS Server
- Paste in the URL copied from the web map feature layer details page
At this time, connections to ESRI ArcGIS Feature Layers automatically create an extract (no live connection), so to update your data, you’ll have to refresh the extract (automatically or manually):
Displaying the Data in Tableau
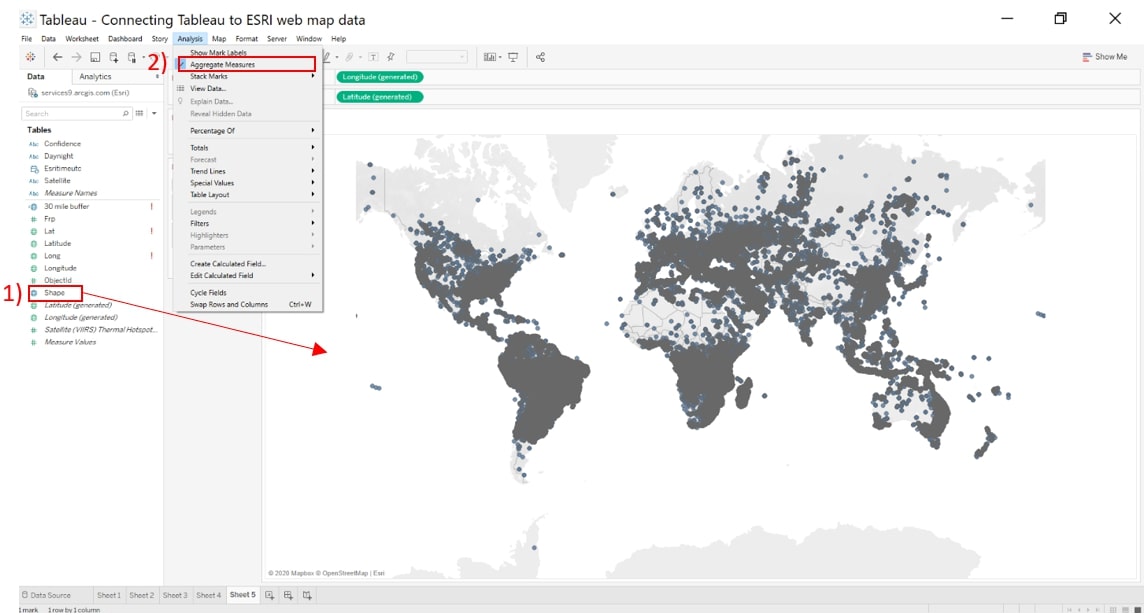
To displaying an ESRI Feature Layer, you will use a field that contains the geometry for each record. In this case, [Shape] is the field that contains our geometry, though you may also see a field called geometry:
- Find the field [Shape] and drag it into the view
- Disaggregate marks via Analysis > and uncheck Aggregate Measures
Now, we have all individual thermal hotspots plotted on a map. From here, we can work our Tableau magic and proceed with visualization and analysis. For me, I was attempting to see two things:
- Only display the hotspots detected in the last three days (over aerial imagery for better context)
- Show recent detected hotspots within 30 miles of my house
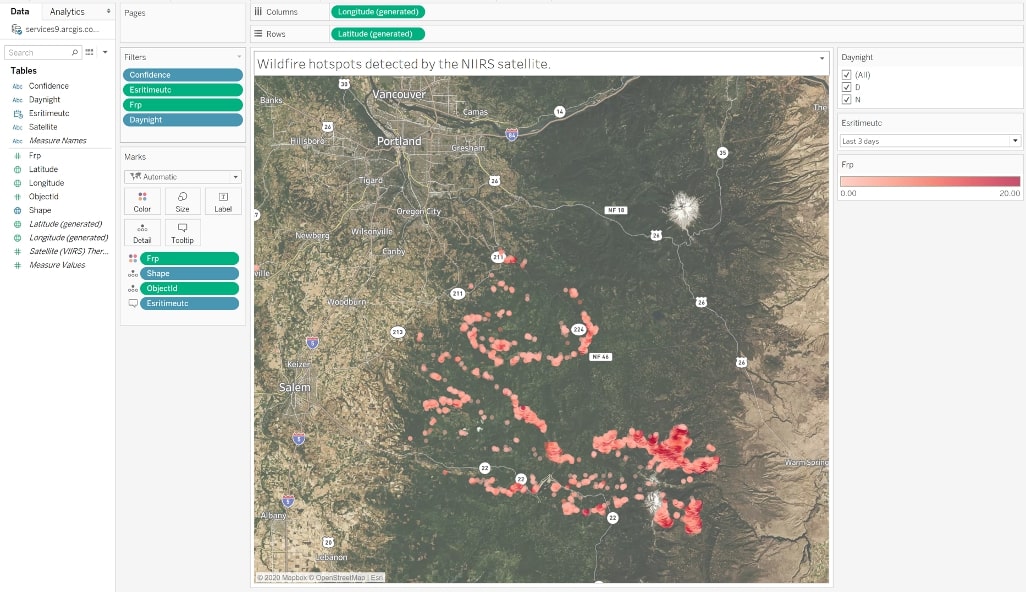
Thermal Hotspots Detected in the Last Three Days
Now that the points are in Tableau, I can use filters and color to my advantage to find the most recent (within three days) detected thermal hotpots in my area. I added the imagery base map for more context and to distinguish the type of landcover that’s currently burning:
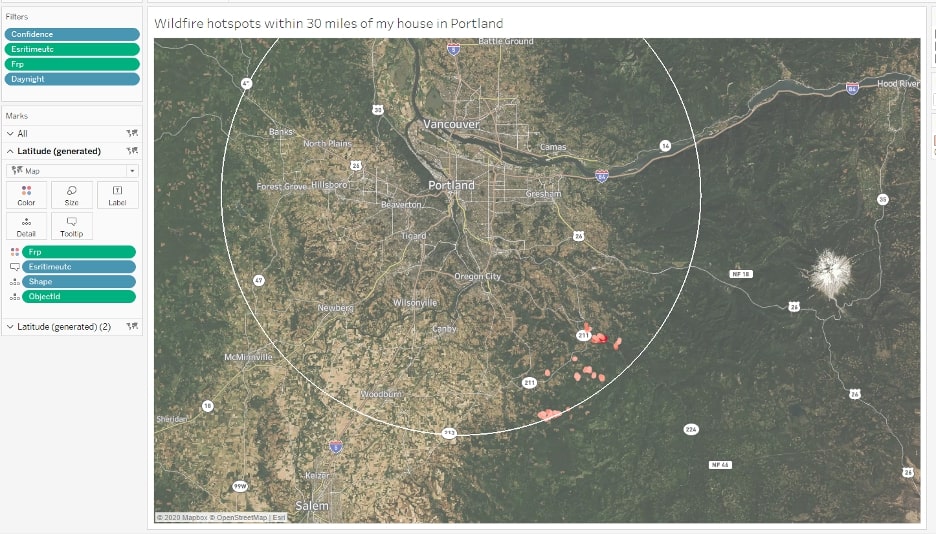
Thermal Hotspots Within 30 miles of My House in Portland, Oregon
Tableau has some built-in spatial analysis features, such as the buffer calculation, that I can use for my analysis. I can use buffering to answer the question, “Are there any thermal hotspots within 30 miles of my house?”.
To set up this buffer analysis, I connected a second data source that contains the latitude and longitude of my house (HomeLocation). I then set up a spatial join calculation that performs an inner join where the Thermal Hotspot data source to the Home Location data source where the former data source is within 30 miles of the latter:
The result is that Tableau will display only those thermal hotspots within 30 miles of me. From this analysis, I now know NOAA’s VIIRS satellite detected with confidence 139 different thermal hotspots within 30 miles of me over the last three days … Yikes!