
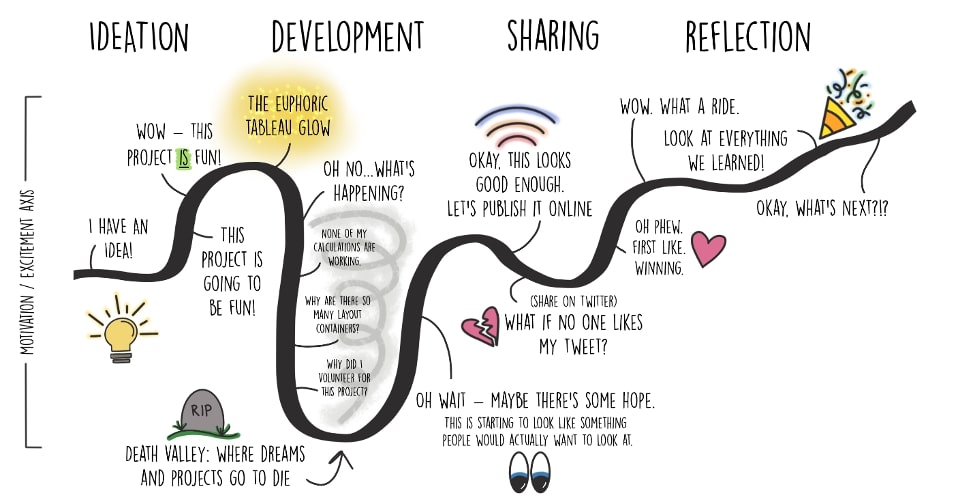
Have you experienced this? You have a fun idea for a dashboard. Just a little side project for your Tableau Public profile. You start out enthusiastically, full of excitement about the possibilities. But then you find yourself on version three, version four … version eleven … version “Will this ever be done?!” Endless revisions are killing the enthusiasm you had at the beginning of your project. You’re spiraling deep into Death Valley—where Tableau dreams and projects go to die—and your dashboard may never emerge if you don’t find a way to rescue it.
Yeah, we feel your pain. We’ve been there, too. In fact, it happened to us with the recent Spotify Wrapped dashboard we put together. If you’re down for a bumpy ride, we’ve shared our journey through the highs and lows of this project, as well as some lessons learned, in this post and another soon to come.
Kendra’s Perspective
About a year ago, I saw InterWorks share their collective Spotify Wrapped of 2018, and I loved it! As a Premium Spotify listener who enjoys discovering new music and almost always has some tunes playing, I was intrigued to see the collective data behind InterWorkers’ listening habits. As I was in the interview process with the company, I told myself, “If I get the job, I am going to do next year’s Spotify Wrapped dashboard!” And here we are!
There were two things I wanted to get out of this project:
- Push myself outside my ‘data viz comfort zone’
- Build a sweet dashboard that got people talking about music, data and, of course, InterWorks
Growth Through Collaboration
To achieve my first goal, I asked fellow InterWorker Keith Dykstra if he would collaborate with me on the project. I had admired Keith’s work since I joined the company, but since we work on opposite coasts, I hadn’t had the chance to work with him yet. I saw this as an opportunity to learn from him and push the limits on what I could do in Tableau.
The second goal was a bit tougher as I honestly didn’t know what I wanted the final dashboard to look like. I am the type of Tableau developer who has to get into the data and see what’s going on before I get a vision for the project’s direction. I’m also an ‘external thinker,’ so getting to have a partner in crime on this one to talk through ideas really helped. Keith brought a fresh approach on how to think about the data, and, slowly but surely, our vision came to life.
Keith’s Perspective
When Kendra asked me to work with her, I initially hesitated because I was afraid of uncovering a glaring flaw: I’m not very good at collaborating. My ‘good enough’ gauge is apparently broken, so I tend to push projects to the max. My collaborators often find themselves ready to be done by version eight, but I think the project still needs at least twenty more rounds of revisions. All this to say, I often work better alone, when I only have to worry about driving myself crazy.
I didn’t completely trust myself to tone things down on this project, but I also saw an opportunity to try. Eventually, I agreed to collaborate with this disclaimer: “Let’s just have fun,” I said to Kendra as we kicked off the project. “Let’s learn something new and try not to hate this project by the end of it.” I was mostly saying this to myself, and—spoiler alert—I was not entirely successful at all of these things.
The Messy Middle, a.k.a. Descent into Death Valley
Keith’s Perspective
Kendra and I initially came up with exploratory ways of presenting the data, but when we showed our first draft to some colleagues, they sent us in a different direction. Rather than leaving things so open-ended, they encouraged us to take a story-telling approach. So, we went back to the drawing board.
Kendra found some interesting facts about our listening habits, and I started messing around with fun ways to present those facts. I wanted to create an engaging way to lead people through the story, but I soon found myself buried in a mess of floating sheets and trying things with parameter actions I’d never done before. I was still having fun figuring things out, but then things suddenly took a turn for the worse. I got a message from Kendra: she was losing steam.
Kendra’s Perspective
As we got further into development, I started to get imposter syndrome bad. If you’re not familiar with imposter syndrome, it’s basically a little voice in your head saying, “You’re not good enough. You don’t know what you’re doing. Why are you here? Everyone else is better and smarter than you.” Not fun.
From my perspective, Keith had a clearer idea of what he wanted for the final dashboard, and I was worried my ideas and contributions weren’t ‘grand’ enough to fit that vision. We had also created a work stream where we divvied up the efforts, but this ultimately led to us not clearly communicating along the way. We weren’t operating with a shared vision. We were each doing our own things and finding it hard to fit our separate pieces together into a cohesive whole. I was deep in Death Valley, wondering why I had volunteered for this project in the first place.
To Be Continued…
With Keith having second thoughts about getting involved in the project and me feeling in over my head, we needed to have some serious conversations around what it was going to look like if this dashboard were to proceed. Should I step away from the project and let Keith take the reins? How could we combat our feelings of being overwhelmed and essentially start the project over from scratch? Check out the next part of this blog post where we share how we finally turned the corner and what this project taught us about ourselves, working with data and collaborating with others.