
Sam used to live in Excel for financial analysis, that is until he discovered Tableau. In this series, he shares how Tableau can be a massive difference-maker for financial teams.
What is the most valuable commodity for your finance team? You might say people. Well, let’s assume you have the right people, with the right skills, in the right jobs. After that, what would be your answer? My answer would be time.
Time is a scarce resource in my world and I’m sure many finance teams have the same challenge. In my experience, finance departments work with stoicism and perseverance to produce reports for the toughest deadlines. But how often do we step back to consider whether stoicism and perseverance lead to optimal use of time and a mitigation of the pressure applied when time is not on your side?
The Safety (and Limits) of Excel
In my experience, a large proportion of the reports created and distributed by finance teams are developed in Excel. It is the go-to resource and safe haven for financial reports. Excel offers many commonly used functions which can be utilised in formulae. One common attribute of producing reports in Excel is they take significant time to build, update and ensure accuracy. That’s precious time wasted before you can even explain a multi-sheet workbook to end users who may or may not be Excel-savvy.
Perhaps this is a good time to reflect on what actually occurs in your organisation and how much time is used to develop and maintain (e.g. data refresh, formulae edits, filter changes) Excel workbooks. Think of the top 10 reports sent out by your finance team each month. Add up the amount of hours your team spends each month developing and maintaining those reports. Keep those two numbers in mind.
At InterWorks, my team is essentially a combined finance and operation department responsible for producing some key reports to the business. The user groups are varied and include those with and without financial backgrounds. The groups include those from sales, consultants, executives and marketing. We have a limited amount of time to build and maintain Excel reports, so we utilise Tableau as much as we can.
Do More in Less Time with Tableau
Tableau is the tool that hands back time to our finance and operation teams. It also hands back time to the users of the reports we produce. It allows us to co-build and collaborate on reports so we get increased interaction with reports produced.
How does Tableau hand back time, and how much time exactly? My typical day consists of cramming 10 hours of work into an eight-hour day. You may be wondering if Tableau is even helping! Simple answer: If I didn’t utilise Tableau, I’d be cramming 20 hours into an eight-hour day.
With Tableau and Excel, there is a front-loaded cost on development time. Tableau saves the user a huge amount of time that would otherwise be spent on maintaining, updating and insuring accuracy. Actually, the amount of time saved because of Tableau comes from multiple places facilitated by its rich and intuitive features. Next, I’d like to highlight a few features that have helped my team the most.
Live Data Connections
Your first reaction may be: We don’t write code, so how could we connect live to our data? But this is a game changer and saves hours, if not days, maintaining Excel spreadsheets. A key feature of Tableau is its data source connections, which don’t require coding skills. You can connect to most databases if you have the right permissions (like in the image below). With a live connection to your CRM, your Tableau reports can update in real time or on a scheduled basis. Below is the first screen you see when you open Tableau:
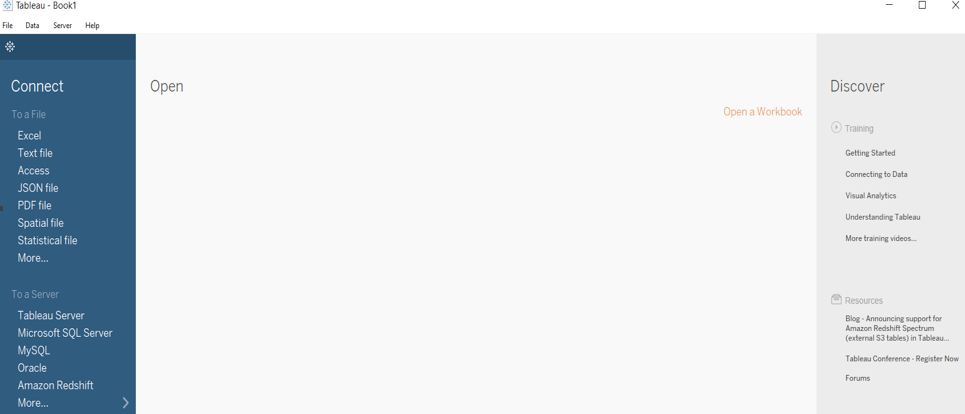
Above: The first screen in Tableau shows a small selection of data source connections.
We let Tableau do the data updates for us. We have published a number of dashboards to Tableau Server that are split into two broad categories: performance reporting and compliance reporting. Data has the power to inform decisions, so we want that data to be up-to-date and in the hands of decision makers.
Users might need data visualised for many different reason such as trend analysis, an investigation of outliers, data entry audit or annual staff reviews. Whatever your reasons are, a dashboard productionised in Tableau and published to Tableau Server places that information in the user’s hands with minimal ongoing maintenance required. As an example, could you produce an Excel workbook that:
- Automatically updates every hour.
- Users can access reports 24/7 on their web browser.
- Users can slice and filter data themselves.
- Allows users to subscribe to the report and have it automatically delivered to their inbox each morning.
- Has different edit, interaction and download permissions based on a user’s login credentials
- Requires an hour each month of maintenance.
Excel can probably not do any one these things, but Tableau definitely can! You can work out for yourself the amount of time Tableau can save you.
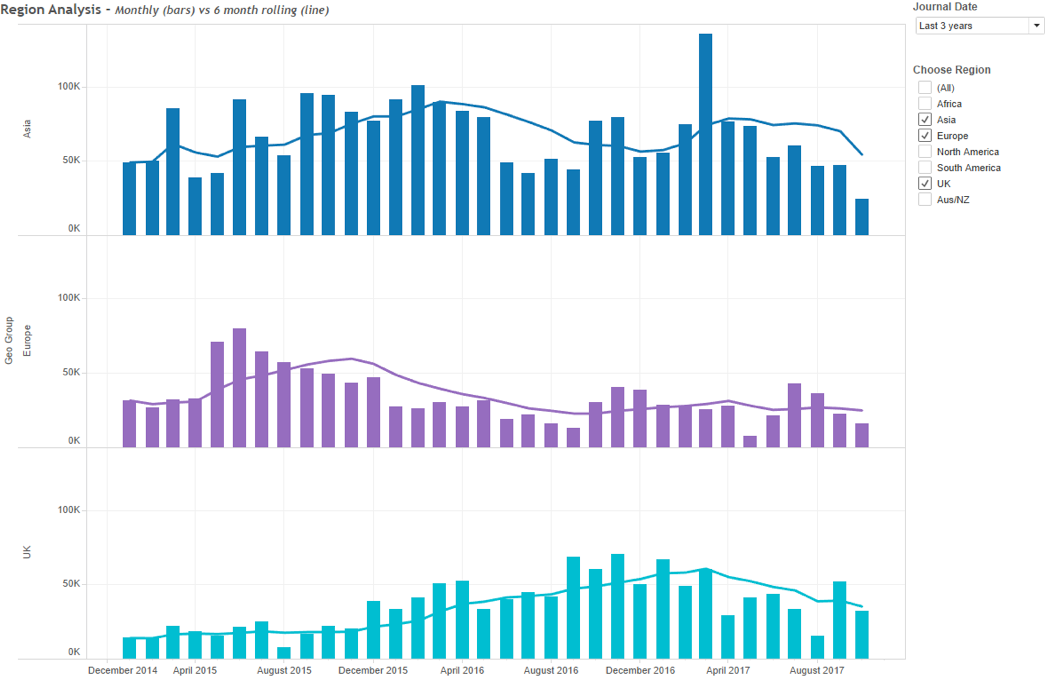
Above: Teams can view their performance over time and can filter by date of region.
How many hours does it take your team to update data in those top 10 reports you identified earlier? How beneficial would it be if that time was handed back to your team? Personally, I use the extra time for a deeper analysis of what’s happening according to the data. I also will collaborate with other departments by using shared dashboards to base our discussions and decisions around data that is current. For me, that’s made an invaluable difference to the way I work with other department leaders.

Above: A compliance dashboard. This helps our team spot T&E expenses that are outside policy. Once the expense is brought in line with policy, it drops off the dashboard.
Unions, Joins and Blending
Once you’ve connected to a data source (e.g. Excel, Microsoft SQL Server), you’ll be able to see all the sheets or tables in your database you can join together. In Excel, you’d have to think about VLOOKUPS, SUMIFS or cross sheet links from other formulae. The beauty of Tableau is, once you decipher the framework of the union or join, it will remember your choice for future use. No need to update lookups and audit formulae when additional rows or columns are added. Tableau does all the work for you.
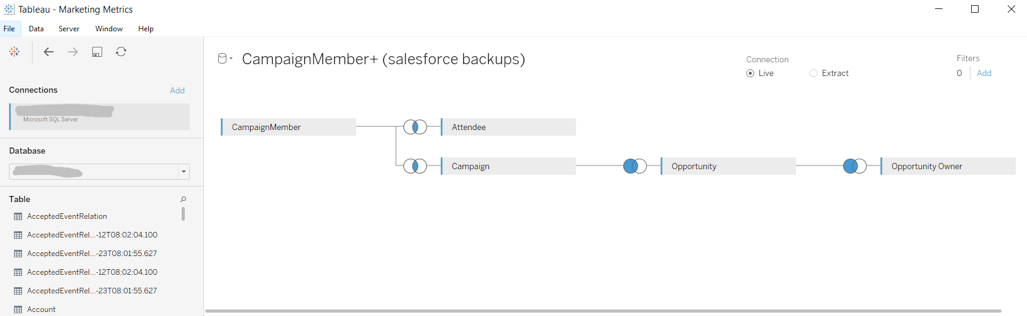
Above: Multiple tables from a Salesforce database are joined together by a simple drag-and-drop feature.
Filters and Self-Serve Reports
This really is one of the premiere features of Tableau. When you build your first dashboard, Tableau allows you to introduce filters based on the dimensions (slicers) or measures (values) in the view. Not only does this allow you to isolate certain aspects of your data analysis, it allows the other users to do the same any time they want in any place they want.
Think of all the questions or requests you receive from users to make report changes (e.g. update the data, change the date range, slice by dimension). If Tableau dashboards allowed users to self-serve, how much time would that hand back to your team?
Next Steps
If you think after reading this, “Wow! Tableau could hand back some time to my team!” Go right ahead and download a trial of Tableau and connect to some data. You’ll soon see how easy it is to get started. It may be unfamiliar territory, so don’t let that dissuade you from continuing. Contact the InterWorks team and we’ll get you where you want to be in no time!