
Parameters – one of the most useful features in Tableau – received an extremely useful upgrade with Tableau version 2020.1. Named dynamic parameters, the user can now refresh a parameter’s list of values based on a column in your data sources or set the current value of a parameter to a calculated field.
So far, so good. Now, there are organizations out there that have not upgraded their Tableau environment, and it is primarily this audience (and all people intrinsically interested in knowing what trickery Tableau is capable of) who will benefit from this blog post about how to mimic dynamic parameters without using dynamic parameters.
Imitate the Functionality of Dynamic Parameters
The problem this design sets out to solve is to open a workbook with filters to a set range-of-date filters with a dynamic period, which the user can change and save. The icing on the cake is that it won’t look like a bunch of menus but like a single filter tool.
This is our roadmap of tasks to accomplish our goal:
- Create and format the default dates that will be shown when the workbook is opened.
- Set up parameters to give the user control over the time period selection.
- Create date filters to filter the charts to the needed time period.
- Include these elements on a dashboard.
And just so you are prepared for what’s coming, we are going to bring in:
- two new sheets,
- five new calculated fields
- three new parameters
So, let’s get our hands dirty!
The How
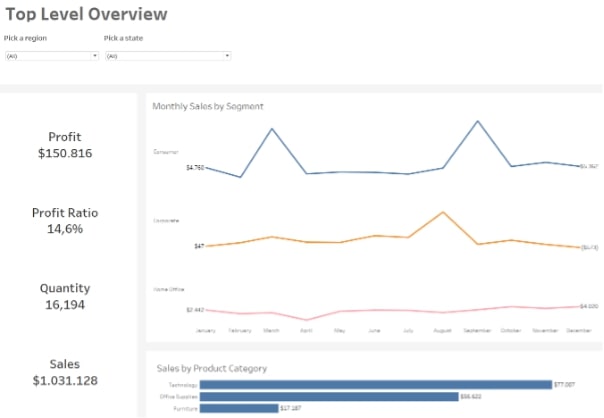
The Sample Superstore is our data source, and the pre-build overview dashboard is our starting point:
Build From- and To-Date Calculations
First, we need to create two sheets, a from and to, which we will name CALC-FROM and CALC-TO. These will be our default dates, and they will be shown once the workbook is opened.
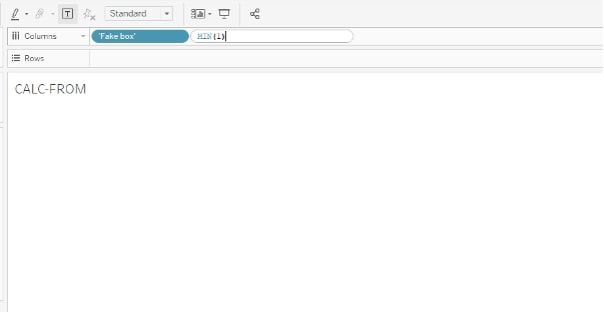
To visualize the dates, we first create a Fake box by double-clicking into the Columns space and naming the pill exactly like this. This technique is called an ad hoc calculation. Further, with the same technique, we add a MIN(1), which will be automatically transformed into a green pill. We do this, so it gives us a fake axis that will later on help fit it into the small view of the date field:
Now let’s bring in our dates. Let’s choose the year 2019 as default period, which is the year with the latest order date. So, the [From Date] calculation looks as follows:
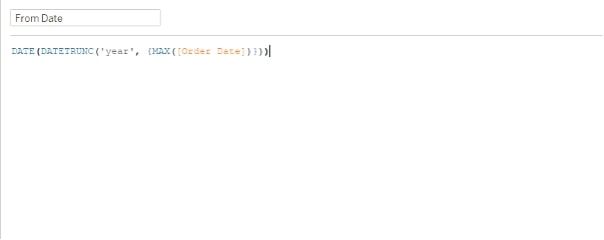
MAX([Order Date]) fetches the latest order date. The curly brackets act as an LOD and calculate the maximum date. And in combination with the DATE and DATETRUNC functions, we get the first day of 2019: 01/01/2019.
Our [To Date] calculated field is simpler:
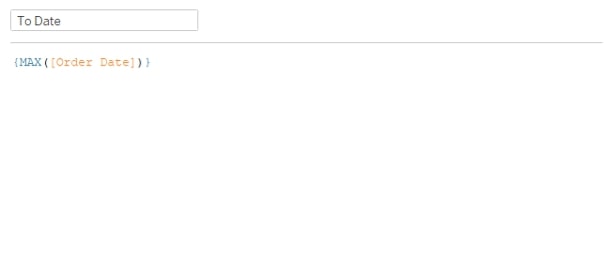
We do not need to truncate and format the date because we immediately get the desired date. Now we bring the date into the view by putting our [From Date] onto Label in the Marks card:
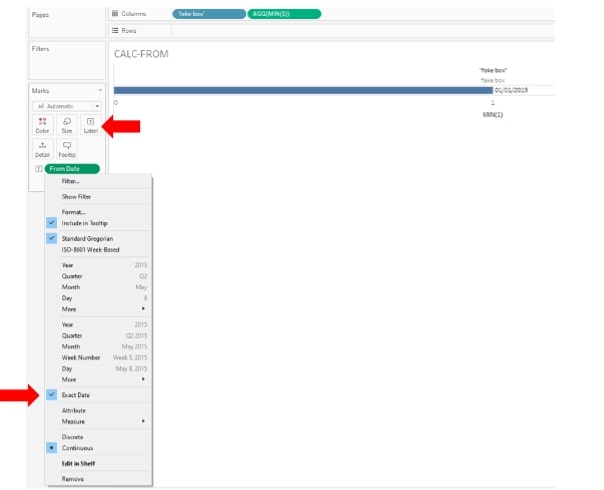
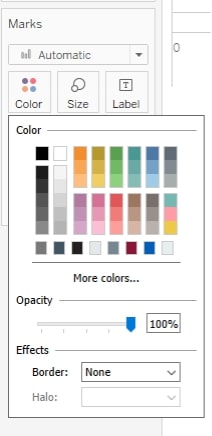
The view does not look like a date selection field yet. We still have a blue bar and multiple axes inside the view. Here is a little trick—we will not remove the bar from the view, but we will make it invisible by clicking on the Color pane in the Marks shelf and selecting white as the bar color and removing the borders:
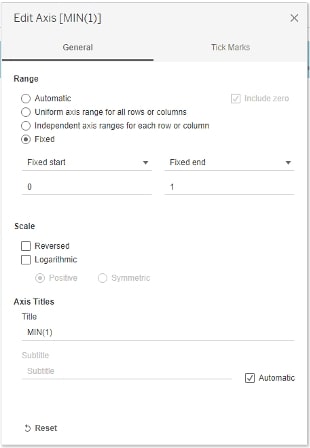
With the bar out of our way, we fix our axis to 1:
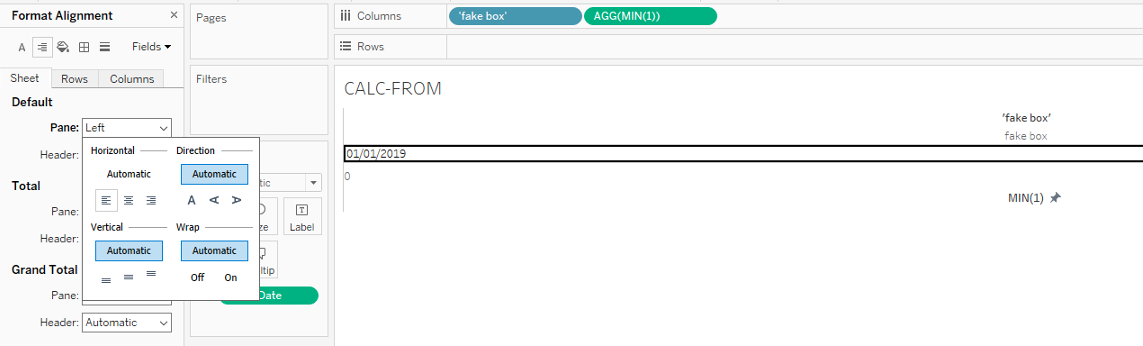
Then we align our date by right-clicking on the date, selecting format and choosing the right left alignment in the Format Alignment pane:
To finish our formatting, we hide all headers from the view by selecting the respective axis and hiding them.
Create Parameters
In this step, we create all the parameters we need to gain full control of the dynamic date period selection. First, we need a parameter that toggles between:
- the default calculated date field usage and
- the date parameter usage, which gets activated when the user clicks into the fields
The new parameter should look like this:
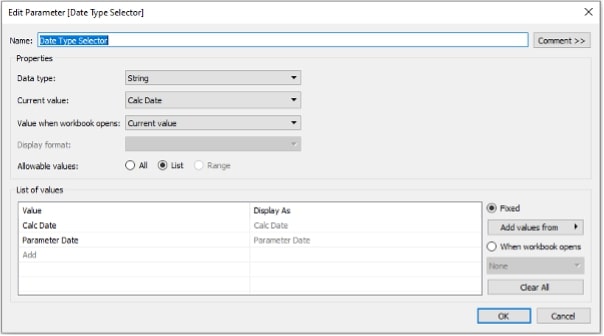
We call the parameter Date Type Selector, and the available options will be:
- the Calc Date (our default option when the workbook is opened) and
- the Parameter Date.
Further, we need to create the From-/To-Date parameters analogous to the previous step. The parameter will look like this:
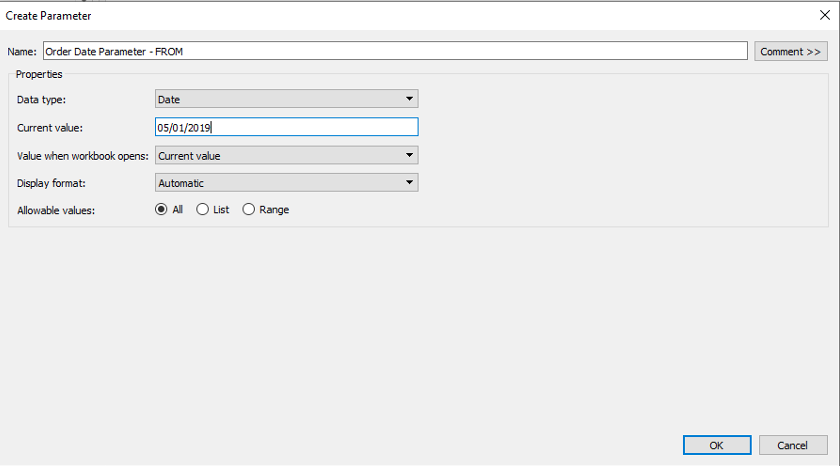
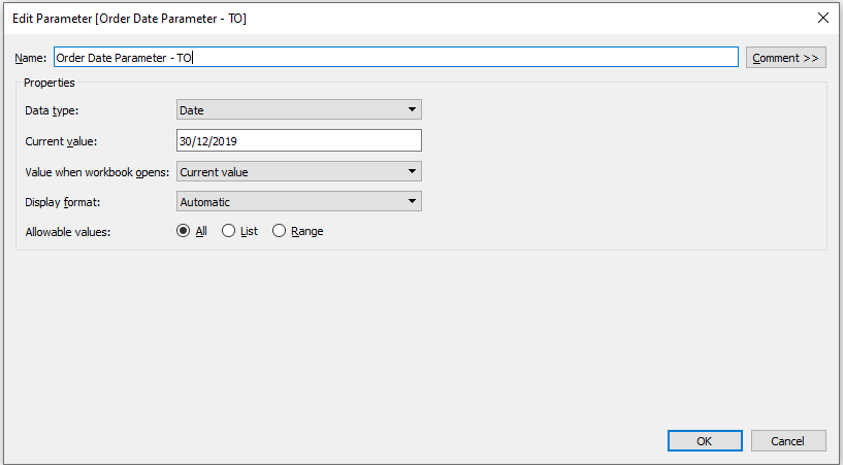
The chosen dates in the parameter creation should correspond to our default dates. To utilize our new parameters, we need to let the system know which date state (Calc Date or Parameter Date) to use. So, we create another calculated field:
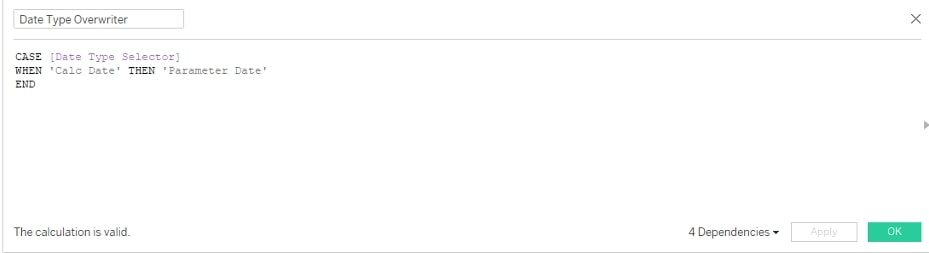
This [Date Type Overwriter] will trigger the state change from the Calc Date filter to the Parameter Date when we click into the Date field to choose our time period.
Since the default dates should only be shown when the parameter state is Calc Date, we need to bring in a filter on our CALC FROM and CALC TO sheets. So, we create another calculated field which mirrors our Date Type Selector parameter:
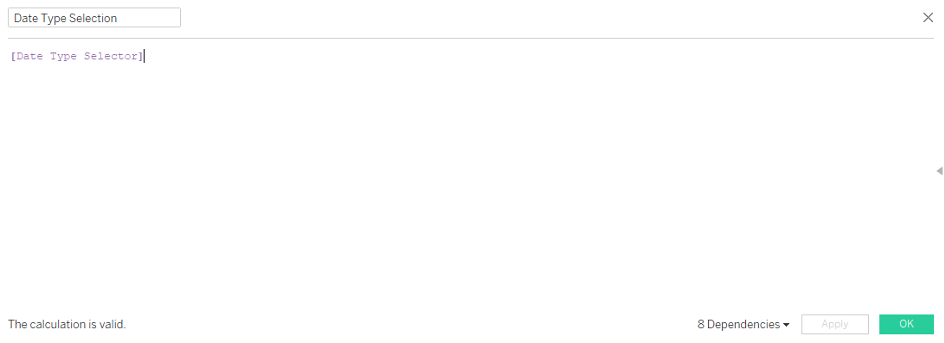
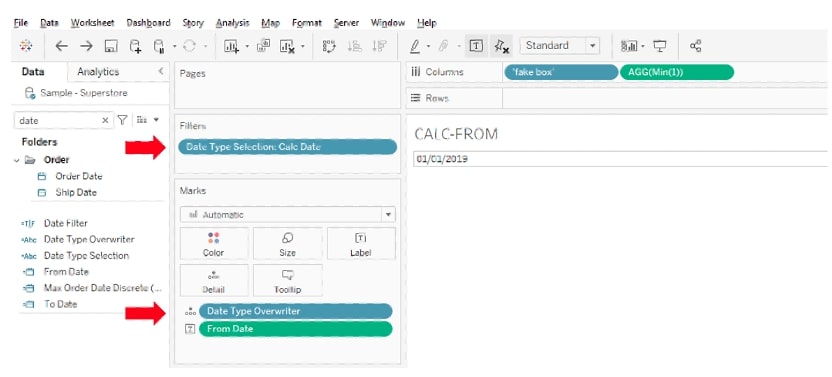
Then we bring this new calculated field into the CALC FROM and CALC TO sheets as a filter set to Calc Date. The [Date Type Overwriter] needs to be put in as Detail into our Marks card. The CALC FROM sheet should look like this:
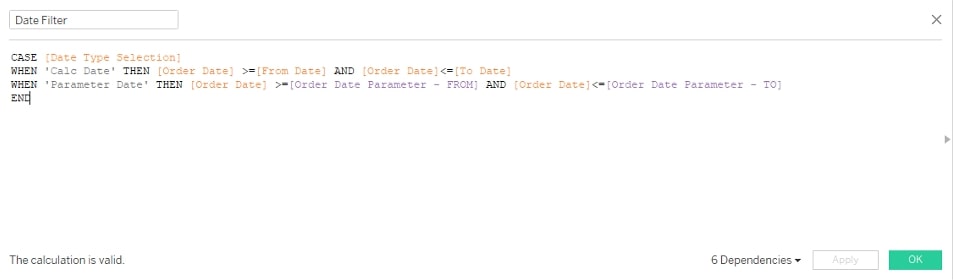
Date Filter
Now we need to bring these dates into our pre-built charts. To do that, we create another calculated field in which we fetch the [From Date], the [To Date] or the dates from the parameter,r depending on which state we currently have set. It reads from our parameterized toggle (initially starting with the calculation). Clicking into the TO-/FROM- sheets will change this to the parameter filter usage. Our date filter then looks as follows:
Then we include this filter on all sheets that need to be filtered by date (notice: not on our TO-/FROM- sheets!). In our case, it’s the Total Sales, Monthly Sales, and Sales by Product Category sheets.
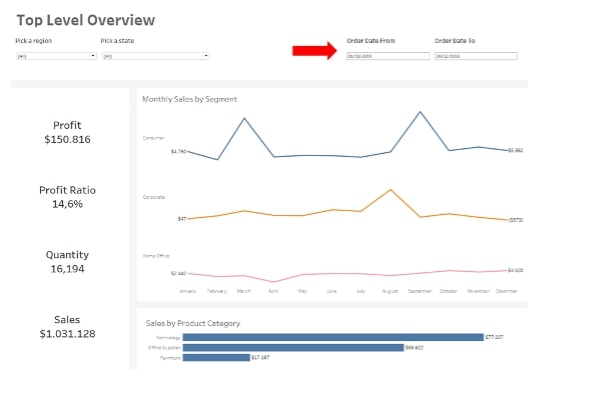
Now we bring these parameters into action. Let’s put these sheets onto our dashboard view. Since we have designed them to look like a single parameter or filter (remember step 1 at the beginning?), these sheets fit neatly into the layout of the dashboard. We put our calculated date fields at the top of the container, and beneath them we include the parameter date fields:
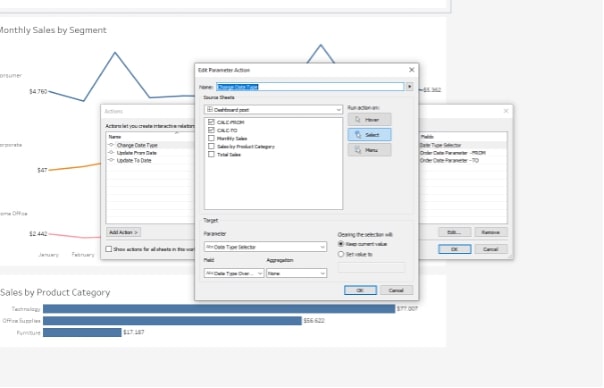
Now we add dashboard action, so that by clicking into one of the sheets, the parameter state switches from calculated date (Calc Date) field usage to the parameter date field (Parameter Date) usage:
Finalize the Dashboard View
Now let’s make it look like we only have one date entry field by using the famous sheet swapping technique. If needed, check out our foundational post on this technique. We need to bring two vertical containers into the view. In the top part of the first container, we place our CALC-TO sheet and beneath it we place the Order Date Parameter – From. We fill the second container with our To-Dates:
The idea behind the sheet swap is to use a filter on the CALC-FROM and CALC-TO sheets, so that when the parameter is toggled to Parameter Date, the two top date fields are swapped away with the sheet swapping technique, and the parameter date control slides to the top part of the container. When the filter is set to Calc Date (like when the workbook loads), the filter is visible.
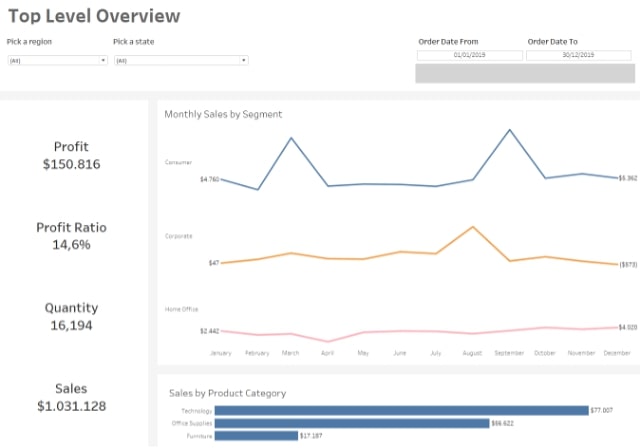
To finalize our little deception, we put a blank container with a white background and float it over the same box to hide the parameter date fields. For illustrative purposes, the blank space has a grey background:
There you have it! Now we can simulate dynamic parameters without using dynamic parameters.
User Journey
Let’s bookend with an overview of the user journey of our new feature:
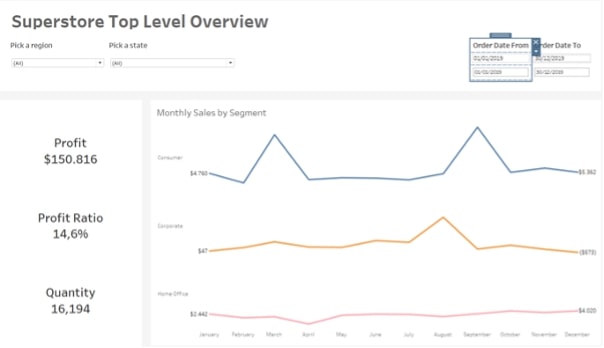
When the workbook is opened, we start by looking at the pre-calculated from-/to-dates. In a perfect world, this is exactly what the dynamic parameters would read from. But this is not a perfect world. So, we initially show this from-/to-range. We can then adjust the range to the liking of our analytical purposes by clicking into the fields (sheets), which updates our toggle. This has some consequences: Our initial from-/to-field hides and we see the parameter date fields, and the parameter state changes from usage of the pre-calculated fields to the parameter date fields.
This technique was an actual use case for InterWorks: a client needed dynamic date ranges. Opening the workbook on a weekly frequency and setting the parameters manually is quite inefficient. Further, the user should be able to choose custom date ranges after loading the workbook. It is possible to also incorporate this into any range, like the most recent week, the last month or the whole dataset. In our client use case, updating to the required Tableau version to use dynamic parameters was not an option. So, my colleague Carl Slifer came up with this interesting solution that I had the pleasure of writing down for you. I hope you found it helpful!
Need assistance with more creative solutions or want to talk through other Tableau strategies? Reach out! We’d love to partner with you.